Measurements of Nuclei Cross Sections with cosmic rays
To accurately measure the fluxes of cosmic-ray nuclei we need to know the interaction cross sections of these nuclei with the thin material within AMS. The material is composed mostly of carbon (73%) and aluminum (17%). The corresponding inelastic cross sections have only been measured below 10 GV for He and C and have not been measured for other nuclei.
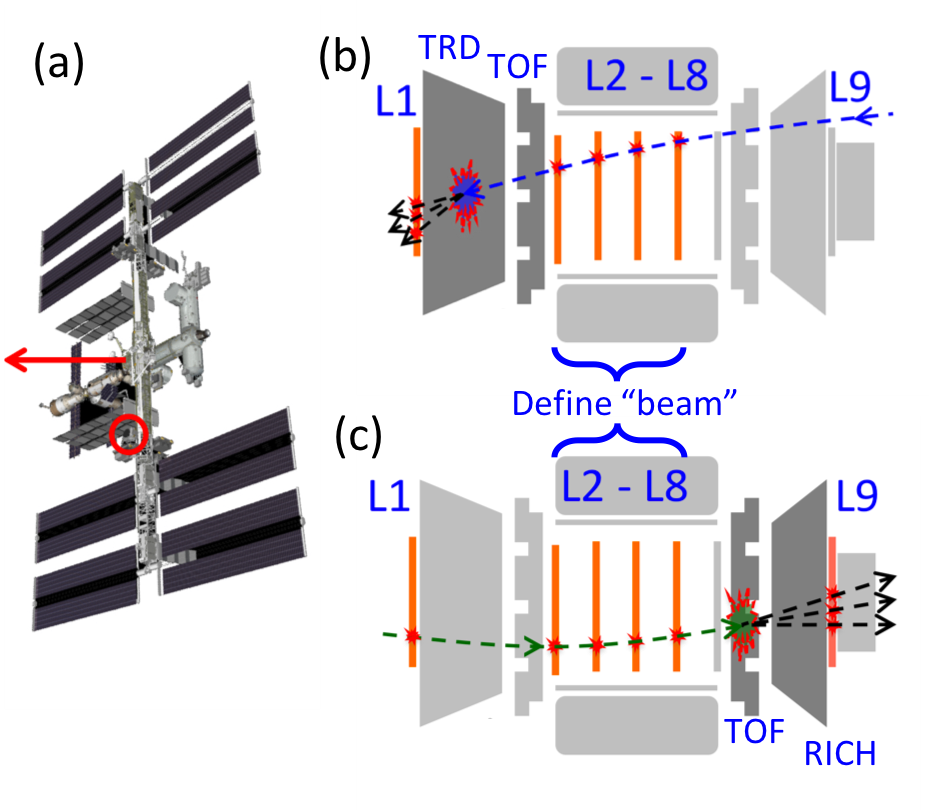
We measured the nuclei survival probability in AMS using data acquired when ISS attitude was rotated so that AMS was pointing in a horizontal direction (see Figure 1a). In this condition, nuclei can pass AMS from L8 to L1 (see Fig 1b) and from L2 to L9 (see Fig 1c). Particles which passed from L8 to L1, or L2 to L9, respectively, were identified by their dE/dx in the seven inner tracker layers L2-L8. We then measured the survival probability for nuclei to traverse the material from L2 to L1 (the upper TOF and TRD, Figure 1b) by comparing the charge distributions between L2-L8 and L1. Similarly, we measured the survival probability for nuclei to traverse the material from L8 to L9 (the lower TOF and RICH, Figure 1c). The survival probability from L8 to L9 has also been measured during AMS nominal operation conditions.
To accurately determine the interaction cross section, dedicated Monte Carlo event samples were simulated with the Glauber-Gribov model inelastic cross sections varied by ±10%. Then the survival probabilities between L2 and L1 and between L8 and L9 were compared between data and the dedicated simulated event samples. The cross section which agrees best with the data above 30 GV was chosen.
The comparison of measured survival probabilities between data and simulations as a function of rigidity are shown in Figure 2 for He nuclei.
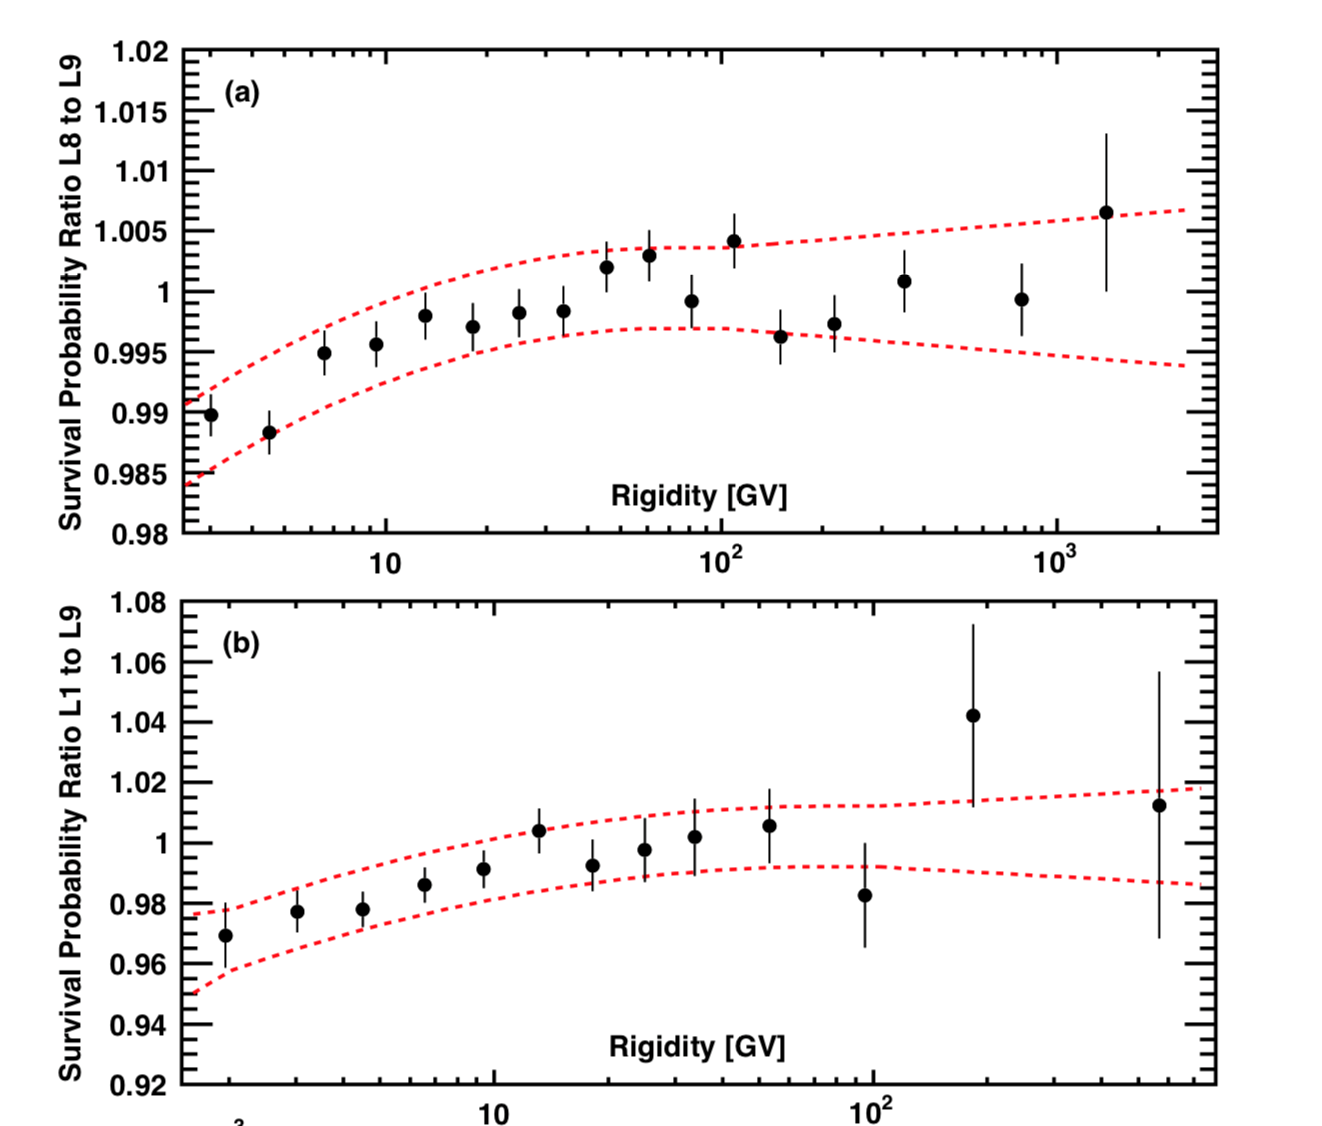
As seen from Figure 2 there is a few percent discrepancy between data and simulation survival probabilities at low rigidities below ~30 GV. We have therefore additionally modified the GEANT4 Glauber-Gribov model to match the AMS data in the entire rigidity range.
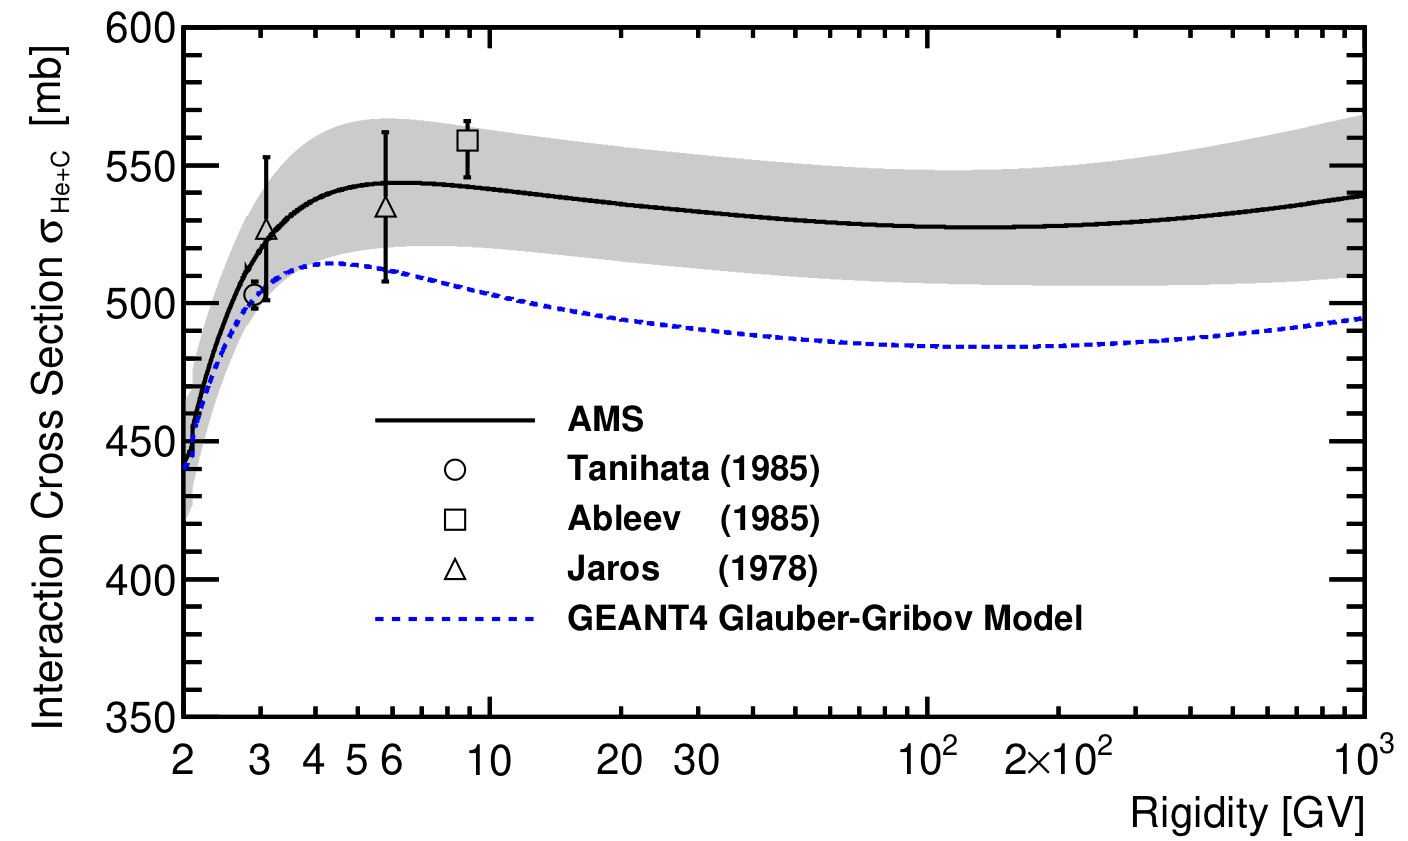
Figure 3 shows the AMS result of the He+C cross section as a function of rigidity together with the original GEANT4 Glauber-Gribov model and measurements from ground-based accelerators.
Similarly, we have measured the survival probabilities for Li, Be, B, C, N, O, and Si nuclei. Measurements for other nuclei are in progress. Below 30 GV, the rigidity dependence of the measured He inelastic cross section is used to modify the Glauber-Gribov model for the description of the heavy nuclei inelastic cross sections.
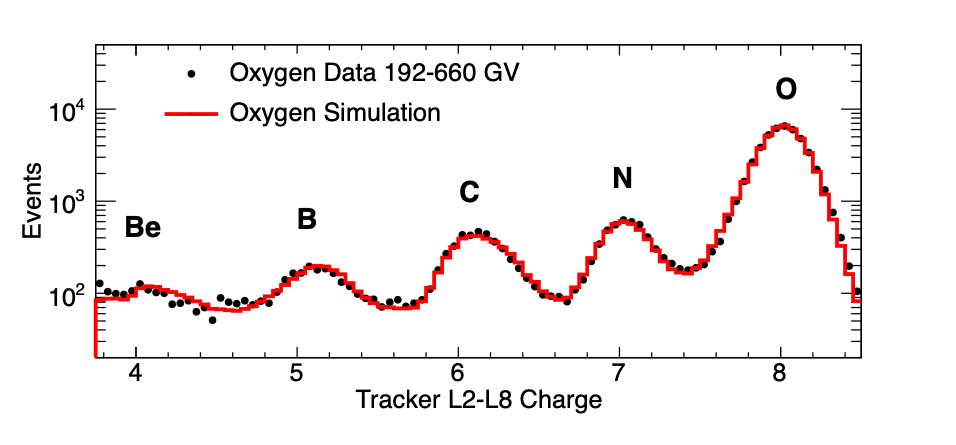
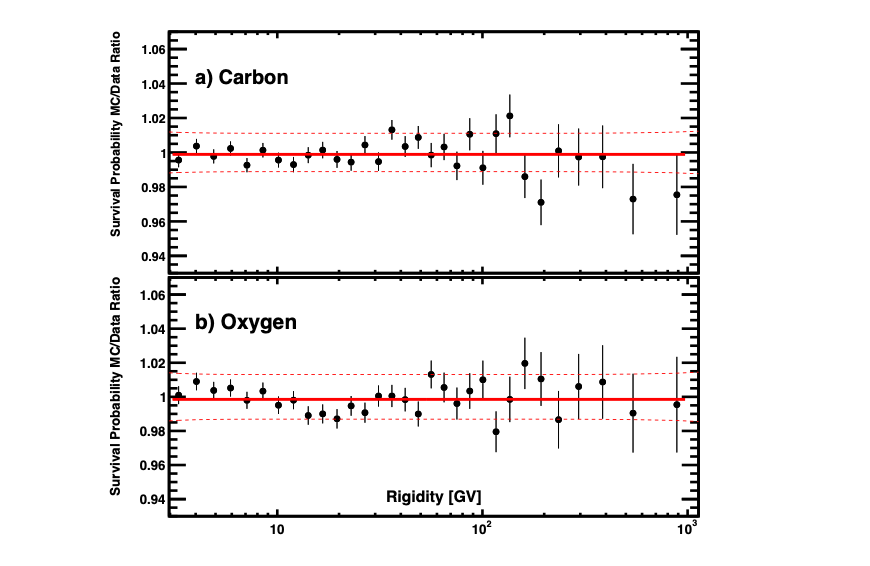
Figure 4 shows the comparison of the survival probabilities for carbon and oxygen between the data and the simulation.
Most importantly, AMS is able to measure interaction cross sections, which were not available from accelerators.
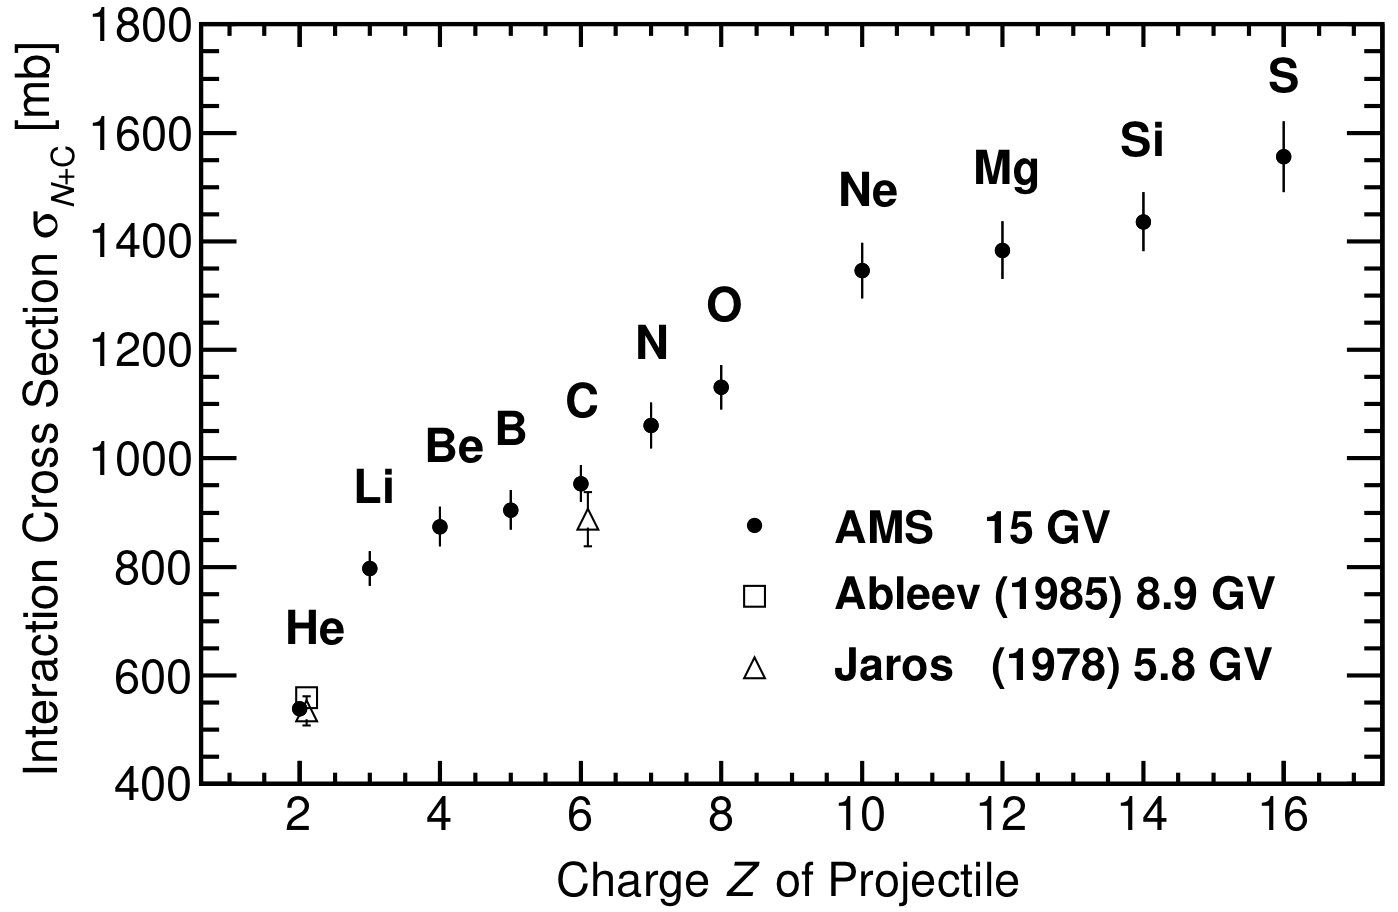
Figure 5 shows the AMS measured nuclear cross sections on carbon for projectile nuclei He, Li, Be, B, C, N, O, Ne, Mg, Si, and S at rigidity 15 GV, together with earlier measurements at rigidities 5.8 GV and 8.9 GV . In this rigidity range from 5 to 30 GV, our measurements show that the rigidity dependence of the inelastic cross section is small <2%. Note that except for helium and carbon, no other measurements exist for other nuclei.
This work is published in [Q. Yan, V. Choutko, A. Oliva, and M. Paniccia, Nuclear Physics A, 996, 121712 (2020)].
The partial cross sections of primary nuclei such as C, N, and O with AMS materials (C, Al) to produce (Li, Be, B … + X) also need to be measured, as nuclei interactions at the very top of AMS, before L1, may become background for secondary cosmic ray fluxes due to the small secondary-to-primary flux ratios. AMS measured these partial cross sections by selecting the primary nuclei with L1 and secondary nuclei with the inner tracker L2 to L8. With these measurements, the simulation of the nuclei interactions has been improved to match the data (see Figure 6 for O nuclei).