Observation of identical rigidity dependence of He, C and O Cosmic Rays at High Rigidities
Primary cosmic rays are believed to be mainly produced by Galactic sources such as supernova remnants. Precise knowledge of their spectra in the GV-TV rigidity region provides important information on the origin, acceleration, and subsequent propagation processes of cosmic rays in the Galaxy. Helium, carbon, and oxygen are among the most abundant primary cosmic ray nuclei.
AMS reported the precise measurements of the helium, carbon, and oxygen fluxes in cosmic rays in the rigidity range from 1.9 GV to 3 TV for helium and carbon, and 2.2 GV to 3 TV for oxygen based on data collected by AMS during the first five years of operation. The total error is ∼3% at 100 GV for both the carbon and oxygen fluxes and ∼1.5% at 100 GV for the helium flux. The measurement is based on 90 million helium, 8.4 million carbon and 7.0 million oxygen nuclei.
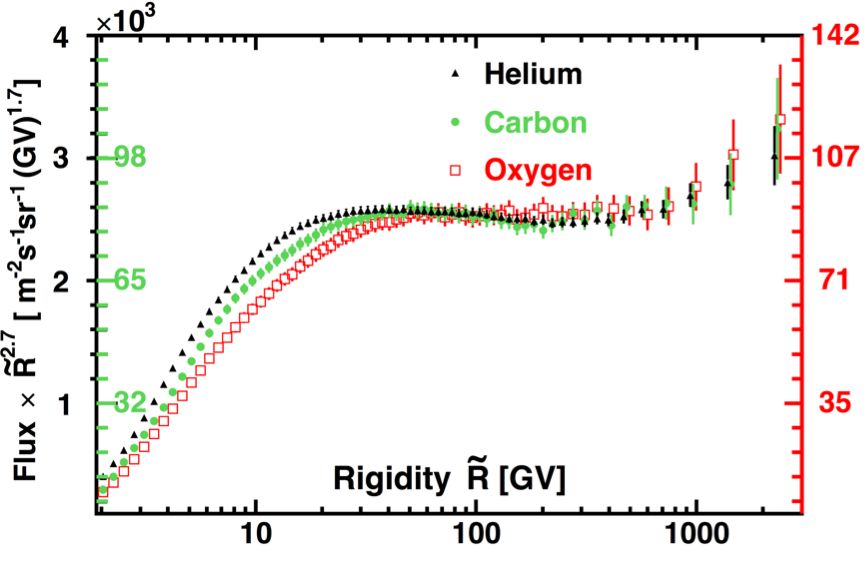
Figure 1 shows the AMS results on the helium, carbon, and oxygen spectra. $\tilde R$ is the spectrally weighted mean rigidity for a flux proportional to $R^{-2.7}$. As seen, above 60 GV all the three spectra have identical rigidity dependence. In particular, they all deviate from a single power law and harden progressively from ~200 GV.
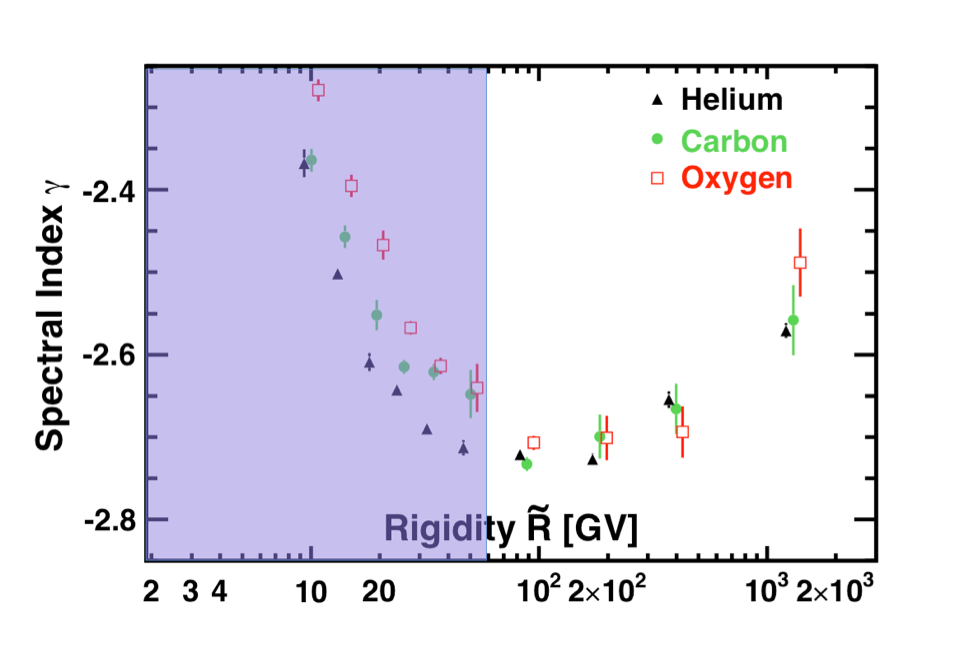
To examine the rigidity dependence of the fluxes, the variation of the flux spectral indices with rigidity was obtained in a model independent way. The flux spectral indices were calculated from $\gamma =d[\log(\Phi)]/d[\log(R)]$ over non-overlapping rigidity intervals above 8.48 GV, with a variable width to have sufficient sensitivity to determine $\gamma$. The results are also presented in Figure 2. As seen, the magnitude and the rigidity dependence of the helium, carbon, and oxygen spectral indices are very similar. In particular, all spectral indices are identical within the measurement errors above 60 GV and all spectral indices harden with rigidity above ∼200 GV.
These surprising results are illustrated more clearly in Figure 3, which shows that the three spectra have identical rigidity dependence above 60 GV.
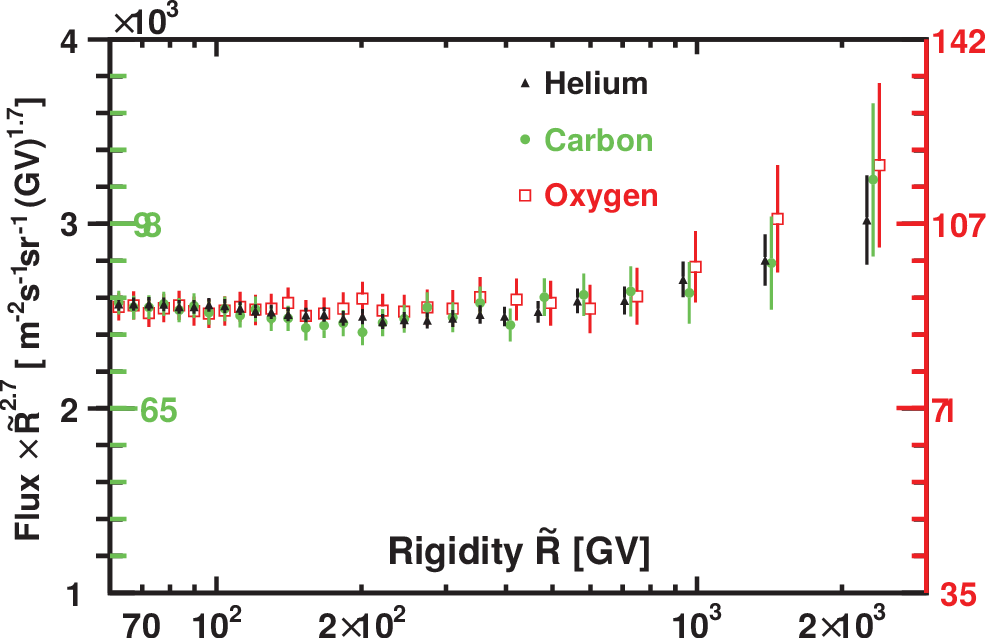
In conclusion, the high statistics measurements of the helium, carbon, and oxygen fluxes from 2 GV to 3 TV show that the fluxes deviate from a single power law. Their spectral indices all progressively harden above 200 GV. Surprisingly, above 60 GV, the three fluxes have identical rigidity dependence.