Improvement in the ECAL Energy Reconstruction
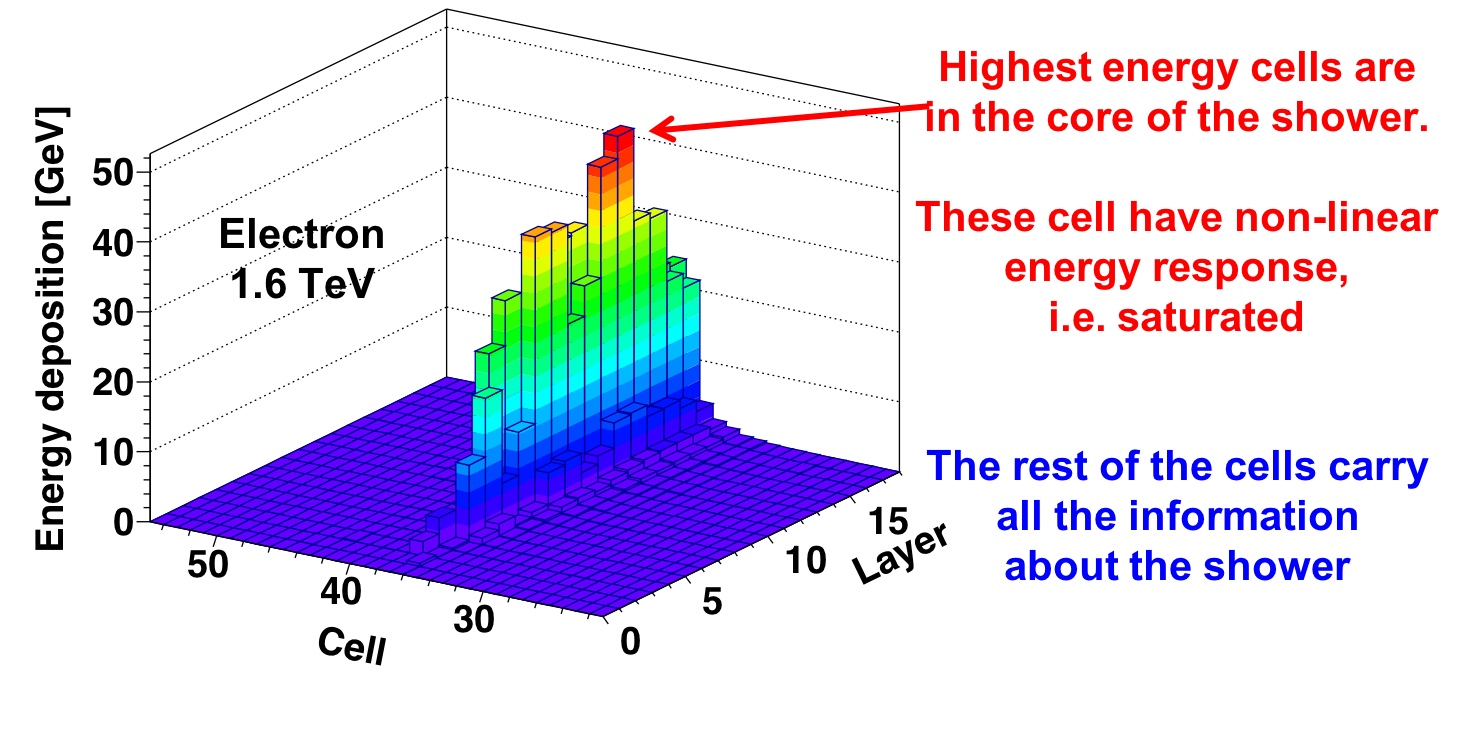
The signal saturation in the electronics is insignificant over the energy range of interest, the remaining saturation is in the calorimeter fibers. It is related to conversion of ionization to light. As illustrated in Figure 1 the effect is maximal near the shower peak, whereas for the rest of the shower, the cells are not affected. Using non-saturated cells allows an accurate accounting for the amount of saturation.
This effect was studied in detail and calibrated using electron showers collected on orbit. First, it was verified that this effect is not related to the electronics — the amount of saturation for large unattenuated signals near the PMT is the same as for attenuated signals far away from the PMT.
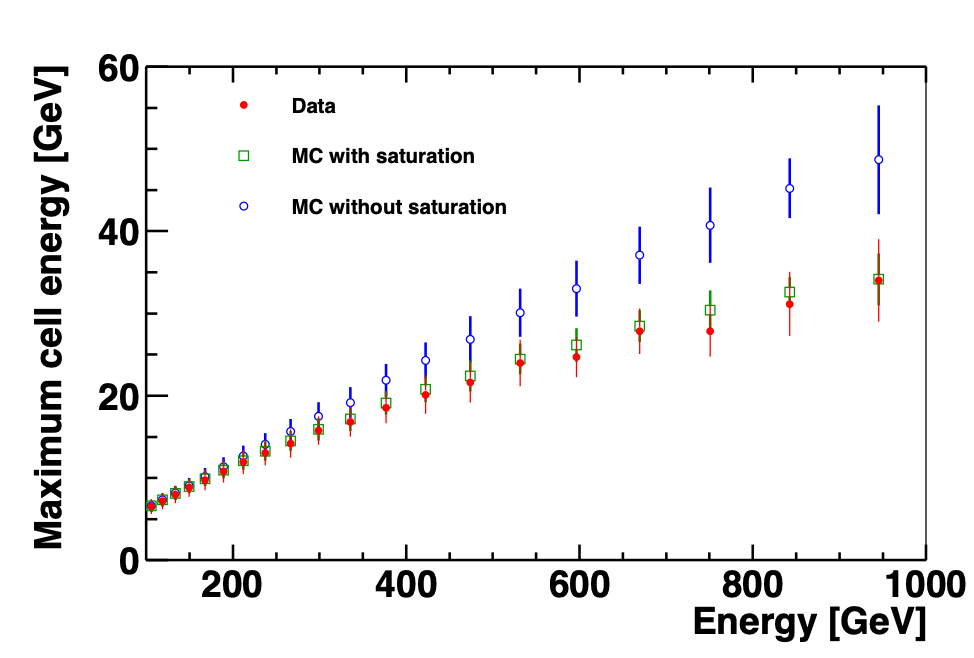
Then the saturation effect is calibrated using the energy dependence of the maximum cell amplitude in the shower. This is illustrated in Figure 2 using a sample of high-energy electrons. There is good agreement between the data and the Monte Carlo simulation if saturation effects are taken into account. On the contrary, if saturation effects are not included in the Monte Carlo simulation, its prediction is significantly above the observation.
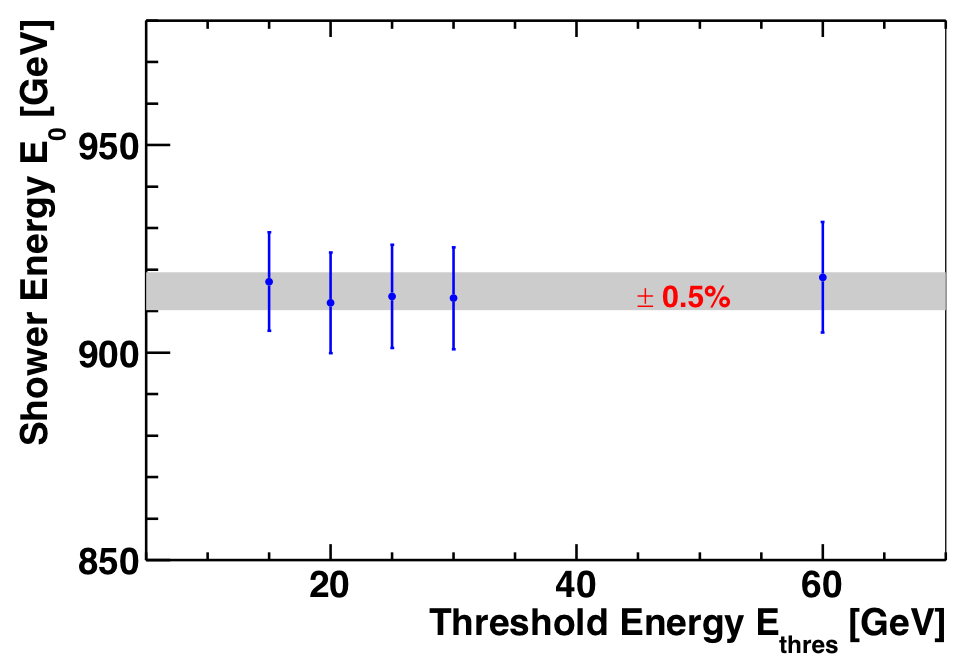
Correction for the saturation effects (see Figure 2) is verified by excluding the amplitudes above a threshold from the fit to the cell amplitudes. Figure 3 shows the effect on the reconstructed energy as a function of the threshold value. As seen, the reconstructed shower energy does not depend on the threshold value.
The new technique provides AMS with a precision energy measurement of electrons and positrons up to multi-TeV.