Observation of Complex Time Structures in the Cosmic-Ray Electron and Positron Fluxes
We published high-statistics, precision measurements of the detailed time and energy dependence of the primary cosmic-ray electron flux and positron flux over 79 Bartels rotations from May 2011 to May 2017 in the energy range from 1 to 50 GeV.
These data allow comprehensive studies of the energy and charge-sign dependence of short-term effects on the time scale of months, related to solar activity, and long-term effects on the time scale of years, related to the 22-year cycle of the solar magnetic field.
Time-dependent structures in the energy spectra are expected from the solar modulation of interstellar cosmic rays when they enter the heliosphere. Solar modulation involves convective, diffusive, particle drift, and adiabatic energy loss processes. Only particle drift induces a dependence of solar modulation on the particle charge sign. Since electrons and positrons differ only in charge sign, their simultaneous measurement offers a unique way to study charge-sign dependent solar modulation effects.
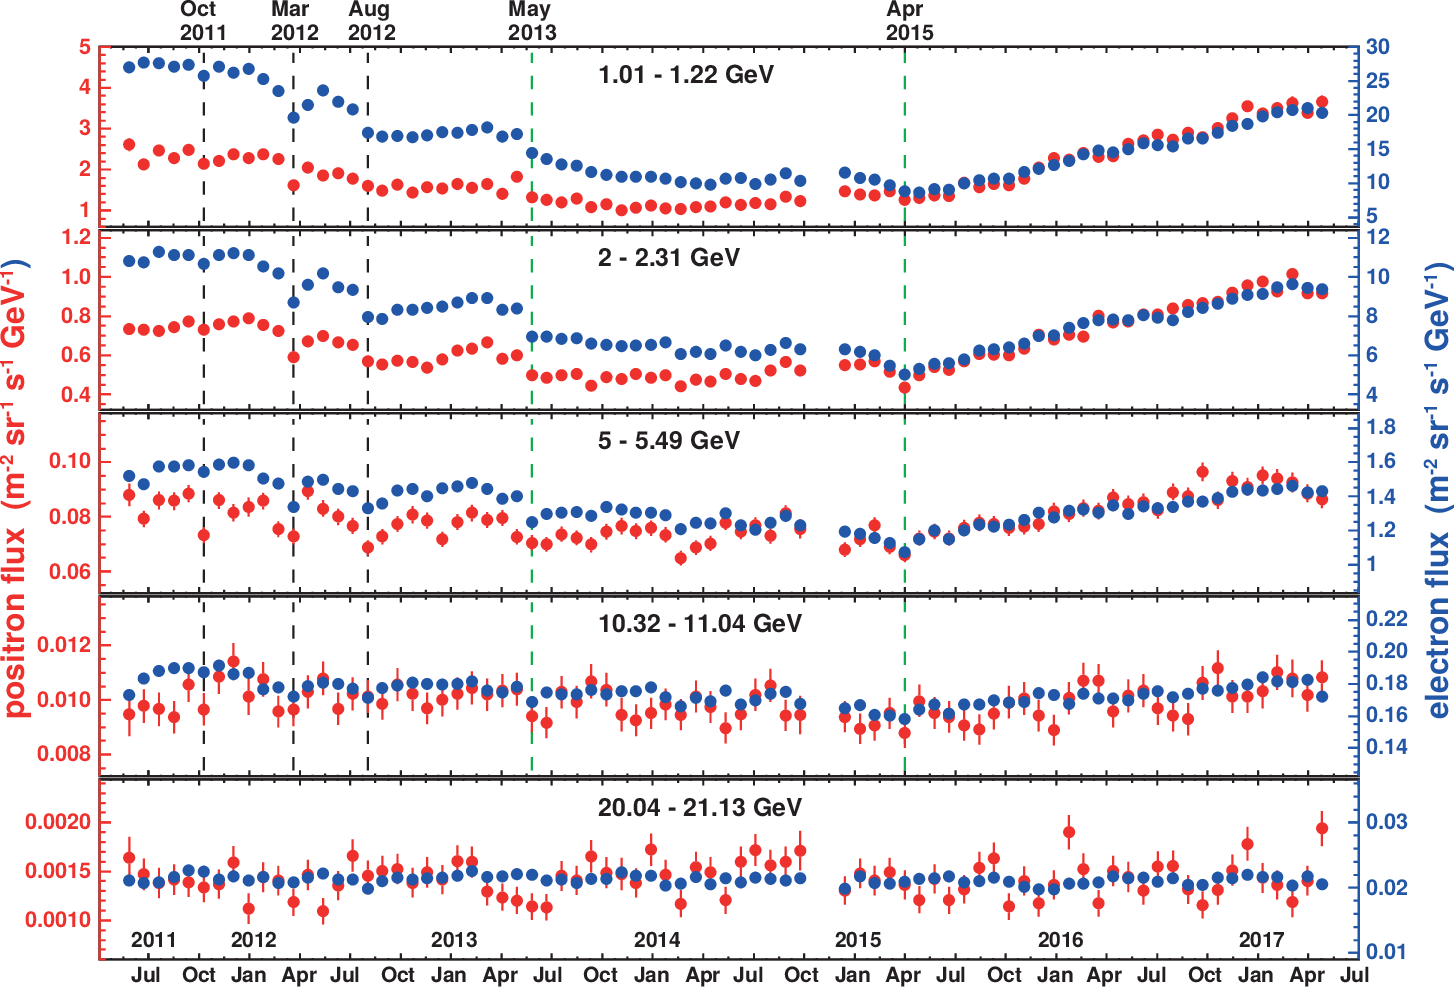
For the first time, the charge-sign dependent modulation during solar maximum has been investigated in detail by leptons alone by AMS. Based on 23.5 million events, we published the observation of short-time structures on the time scale of months coincident in both the electron flux and the positron flux. The fluxes are shown in Figure 1 as a function of time for five characteristic energy bins. We find a clear evolution of the fluxes with time at low energies that gradually diminishes towards high energies. At the lowest energies, the amplitudes of both the electron flux and the positron flux change by a factor of 3. Both fluxes exhibit profound short- and long-term variations. The short-term variations occur simultaneously in both fluxes with approximately the same relative amplitude. Several prominent and distinct structures are observed. They are characterized by minima, visible in both the electron flux and the positron flux across the energy range below $E \lesssim 10$ GeV. These are marked by dashed vertical lines in Figure 1. At energies above 20 GeV, neither the electron flux nor the positron flux exhibits significant time dependence.
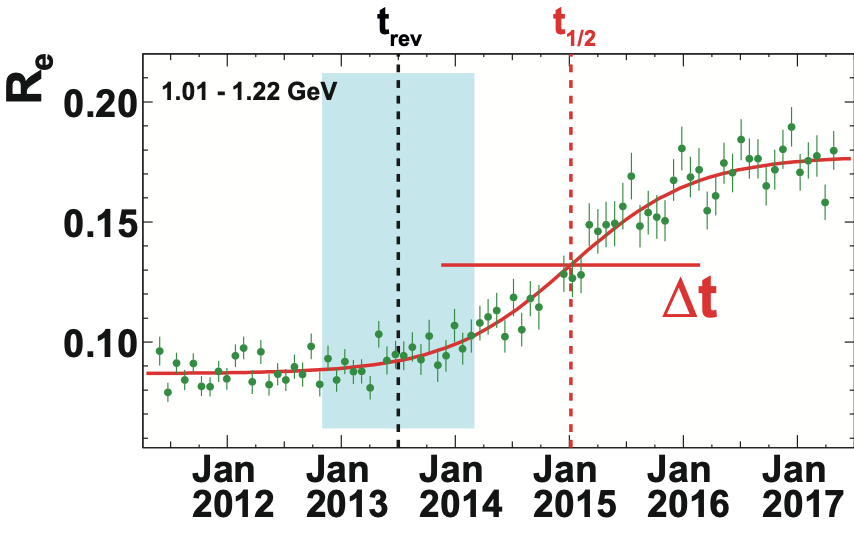
The long-term time structure of the data in Figure 1 shows that the changes in relative amplitude are different for electrons and positrons. To quantify this effect, we use the $e^{+}/e^{-}$ flux ratio $R_e$, shown in Figure 2. In $R_e$, the important, newly discovered short-term variations in the fluxes largely cancel, and a clear overall long-term trend appears. At low energies, $R_e$ is flat at first, then smoothly increases after the time of the solar magnetic field reversal, to reach a plateau at a higher amplitude.
We use a model independent approach to extract the energy dependence of the quantities that characterize the observed transition in $R_{e}$. With a set of four parameters, the 3871 independent $R_{e}$ measurements as a function of energy and time can be described well with a logistic function:
\begin{equation} \label{eq:1} R_e(t,\, E) =R_0(E)\times \left[1+\frac{C(E)}{{\rm exp}\left(-\frac{t-t_{1/2}(E)}{\Delta t(E)/\Delta} + 1\right)}\right]\end{equation}
At a given energy $E$, the time dependence is related to three parameters in the function: the amplitude of the transition $C$, the midpoint of the transition $t_{1/2}$, and the duration of the transition $\Delta t$. We choose $\Delta = 4.39$, such that $\Delta t$ is the time it takes for the transition to proceed from 10% to 90% of the change in magnitude. The behavior of the logistic function is illustrated in Figure 2 using the fit to data in the energy range [1.01 – 1.22] GeV.
The results of fitting for several energy bins from 1 to 21 GeV are shown in Figure 3. We obtain $\chi^2/{\rm d.o.f} \approx 1$ for all the fits.
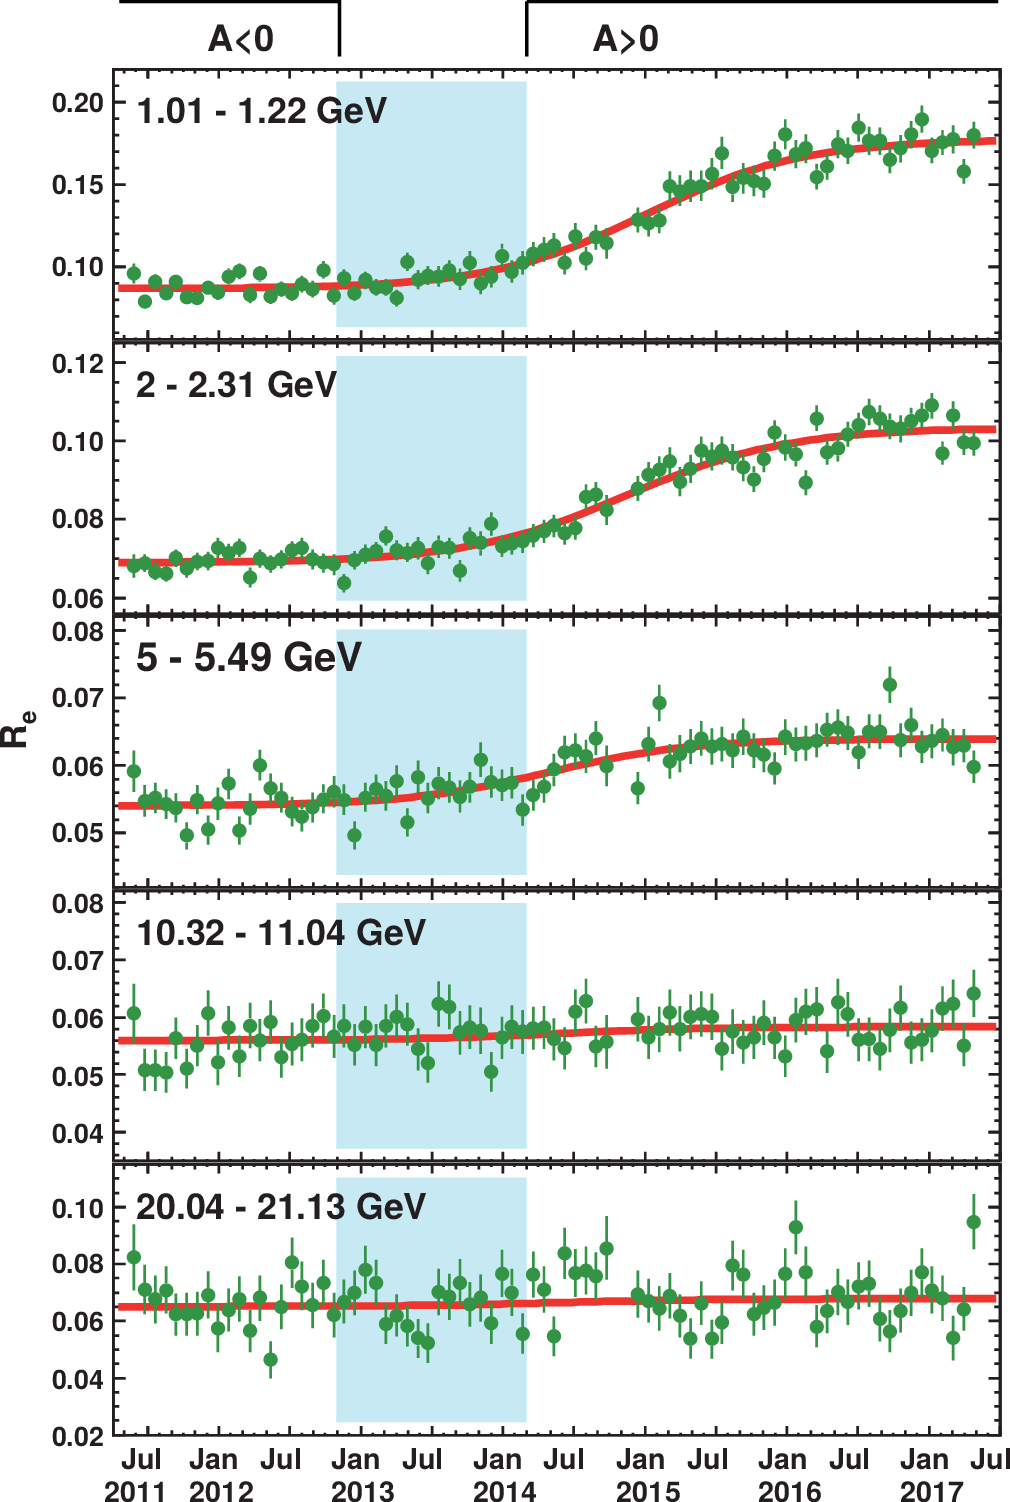
The parameters $t_{1/2}$ and Δt can only be determined at low energies, where the amplitude of the transition is large, see Figure 3. The energy dependences of these parameters are shown in Figure 4. As seen, the transition duration Δt is independent of energy (Figure 4a), and we obtain a value of $830\pm 30$ days. The midpoint of the transition, $t_{1/2} - t_{\rm rev}$, shows an energy dependent delay relative to the reversal and changes by $260\pm 30$ days from 1 to 6 GeV, as seen in Figure 4b.
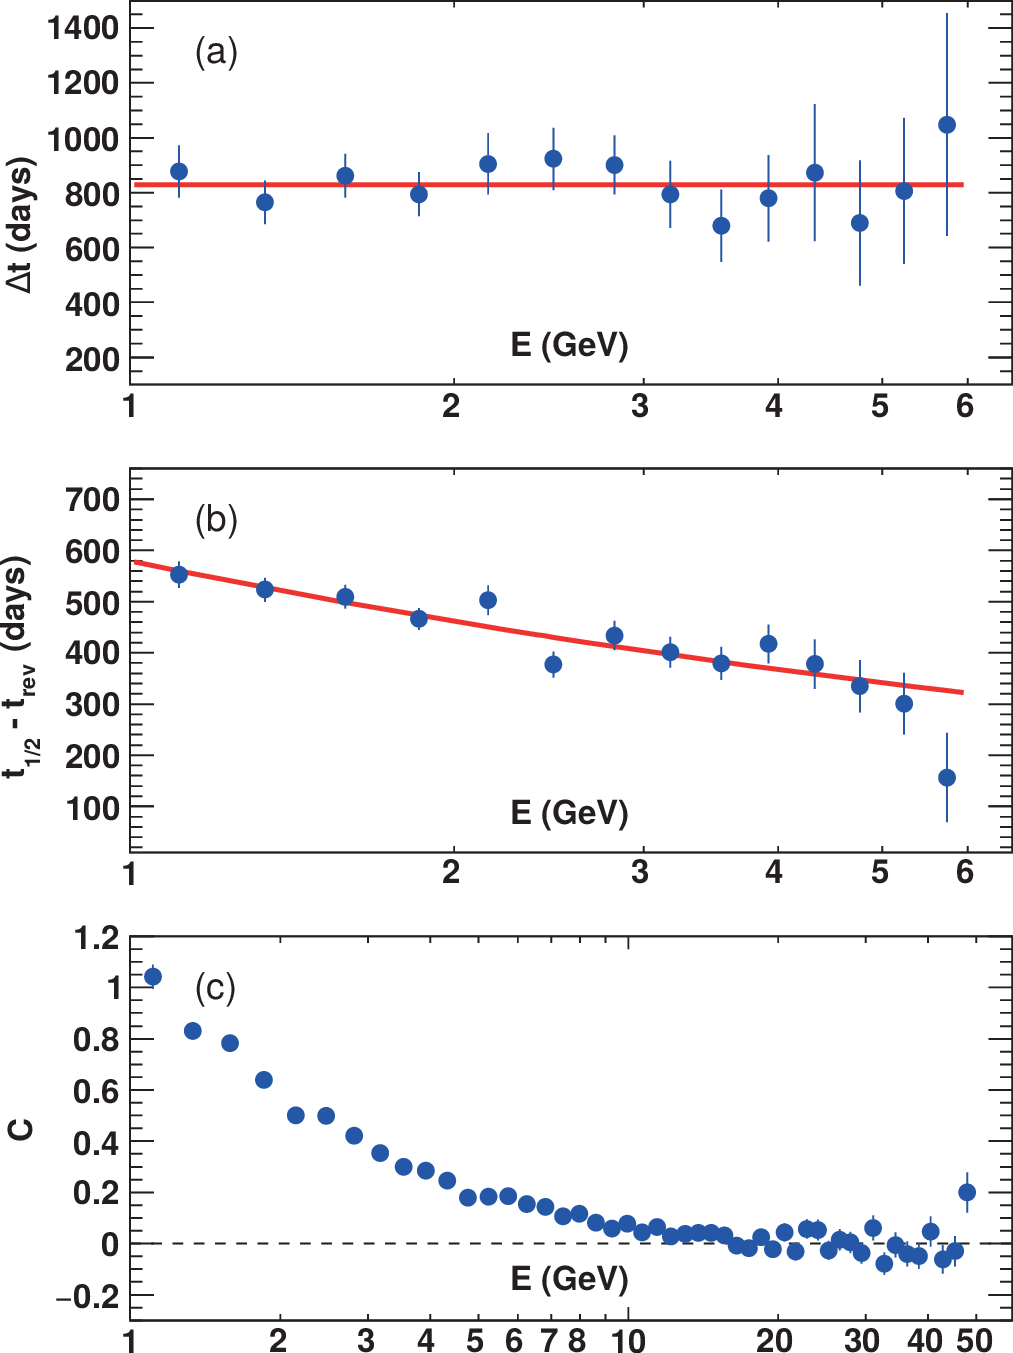
To study the amplitude C in Figure 4c, we have fixed $\Delta t$ to its average value of 830 days and we use the value of $t_{1/2}$ calculated from Eq. (\ref{eq:1}) for energies above 6 GeV. At high energies, the fit result for the amplitude depends only weakly on the choice of the values for $\Delta t$ and $t_{1/2}$. As seen in Figure 4c, the amplitude $C$ is close to 1 at $E=1$ GeV and decreases smoothly with energy. This is in qualitative agreement with the expectation from solar modulation models including drift effects. Above 20 GeV, the amplitude is consistent with zero.
In conclusion, for the first time, the charge-sign dependent modulation during solar maximum has been investigated in detail by leptons alone. We observe prominent, distinct, and coincident structures in both the positron flux and the electron flux on a time scale of months. These structures are not visible in the $e^+/e^-$ flux ratio. We also observe the existence of a long-term feature in the $e^+/e^-$ flux ratio, namely, a smooth transition from one value to another, after the polarity reversal of the solar magnetic field. The duration of the transition is measured to be $830\pm 30$ days, independent of energy. The transition magnitude is decreasing as a function of energy. The midpoint of the transition relative to the polarity reversal of the solar magnetic field changes by $260\pm 30$ days from 1 to 6 GeV. These high-statistics, precision data on positrons and electrons provide accurate input to the understanding of solar modulation.