Observation of Fine Time Structures in the Cosmic Proton and Helium
Cosmic rays entering the heliosphere are subject to diffusion, convection, adiabatic energy losses, and magnetic drift. The temporal evolution of these processes leads to cosmic ray intensity variation at Earth’s orbit around the Sun. These variations correlate with solar activity, which has several cycles. The most significant is the 11-year solar cycle during which the number of sunspots changes from minimum to maximum and then back to a minimum. Another is the 22-year cycle of the Sun’s magnetic field polarity, which reverses every 11 years during the maxima of the solar cycle. Cosmic ray spectra may also have temporary reductions due to the interactions of cosmic rays with strong disturbances in the magnetic field, especially during solar maxima, that can last from days to months. Time correlations at low rigidity among different particle spectra (p, He) due to solar modulation are expected by models of cosmic ray transport based on the Parker equation. This is because the time-dependent cosmic ray transport in the heliosphere is rigidity dependent and related to changes in solar activity. Numerous models of the propagation of charged particles in the heliosphere exist that predict different flux variations with time. The large acceptance and high precision of AMS allow us to perform accurate measurements of the fluxes as functions of time and energy. This provides unique information to probe the dynamics of solar modulation, to allow the improvement of constraints for dark matter search, to investigate the processes of galactic cosmic ray propagation, and to reduce the uncertainties in radiation dose predictions for deep space human exploration.
We published the time evolution of the proton flux from 1 to 60 GV based on 846 million events and the helium flux from 1.9 to 60 GV based on 112 million events. The proton flux and the helium flux are measured for the 79 Bartels rotations (each 27 days) from May 2011 to May 2017. For the first time, proton and helium fluxes are simultaneously measured with the same precision instrument for an extended period of time.
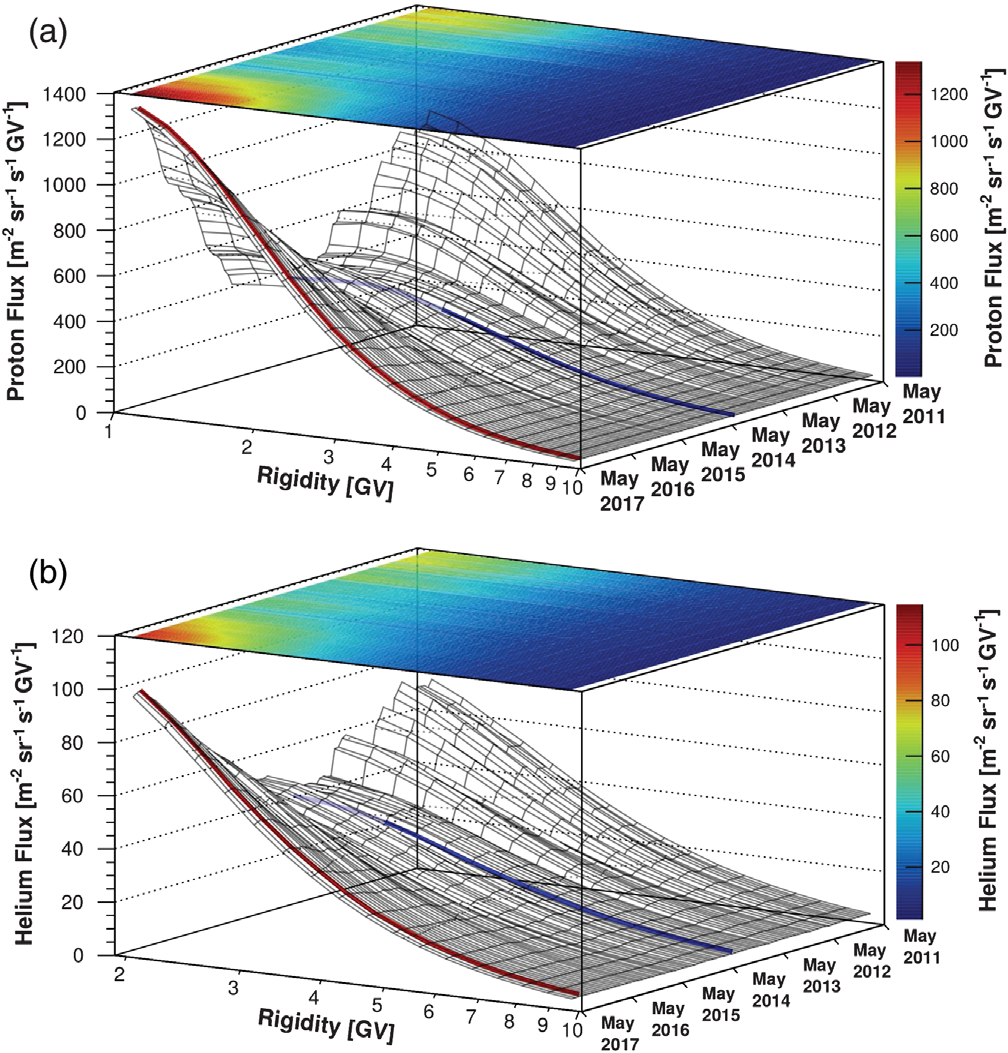
Figure 1 shows the detailed behavior of (a) the proton flux and (b) the helium flux as functions of time and of rigidity from 1 to 10 GV and from 1.9 to 10 GV, respectively.
The time dependence of the proton and helium fluxes are shown in Figure 2 for 8 characteristic rigidity bins. As seen, both the proton and helium fluxes have fine time structures each with maxima and minima. The structures in the proton flux and the helium flux are nearly identical in both time and relative amplitude. In general, the amplitudes of the structures decrease progressively with rigidity. The precision of AMS enables us to observe these structures up to 40 GV. The amplitudes of the structures are reduced during the time period, which started one year after solar maximum, when the proton and helium fluxes steadily increase.
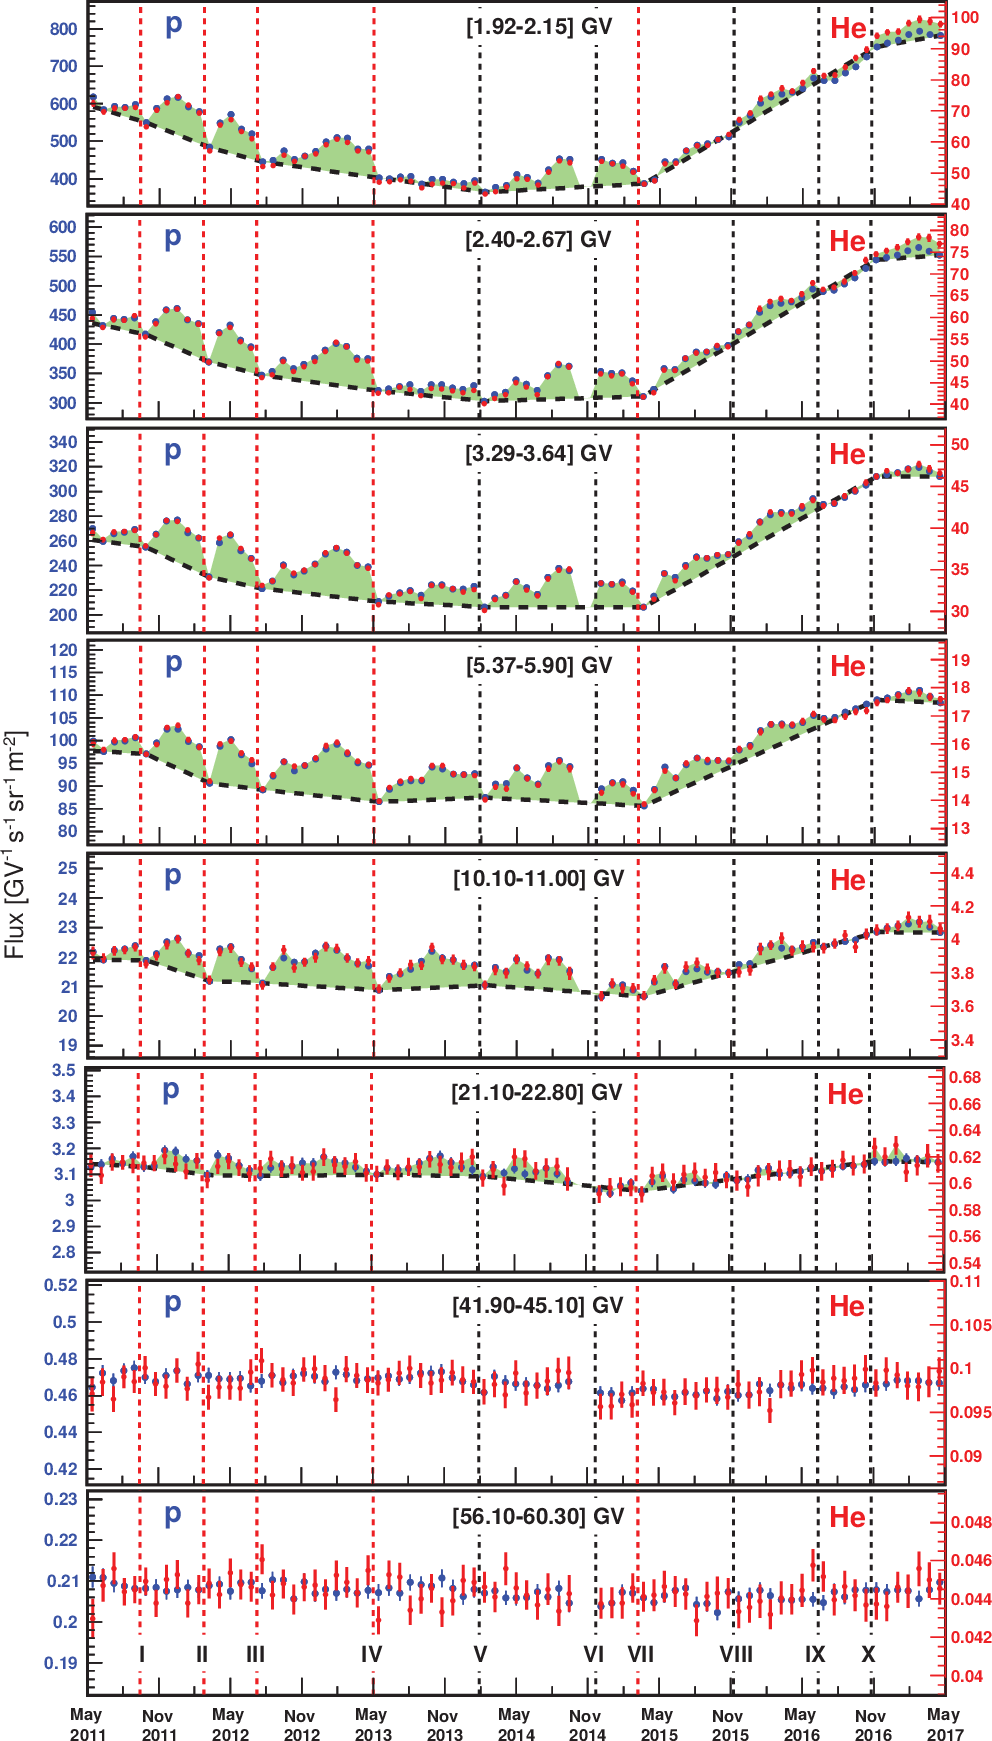
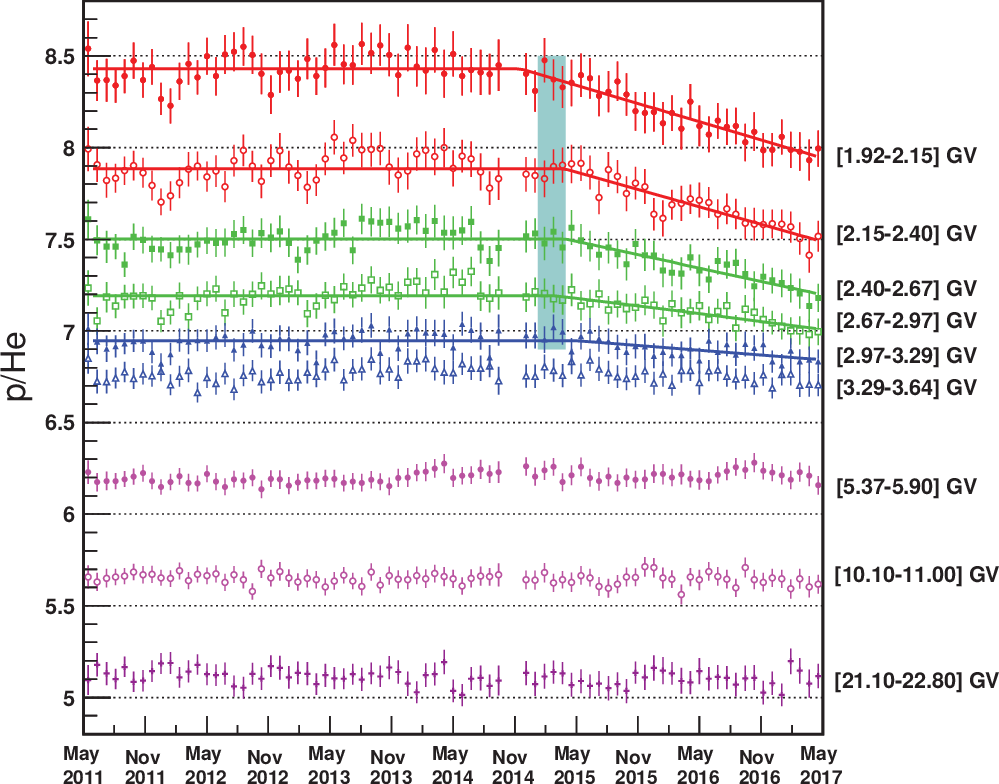
Figure 3 shows the AMS p/He flux ratio as a function of time for 9 rigidity bins. As seen, depending on the rigidity range, the p/He flux ratio shows two different behaviors in time. Above ~3 GV the ratio is time independent. Below ∼3 GV the ratio has a long-term time dependence. To assess the transition between these two behaviors, we performed a fit of the p/He flux ratio $r_i$ for each rigidity bin $i$ as a function of time $t$, with
$$r_i(t) = \left\{\begin{array}{lc}a_i & t < t_i\\ a_i+b_i\left(t-t_i\right) & t\ge t_i\end{array}\right.$$
where $a_i$ is the average p/He flux ratio from May 2011 to $t_i$, $t_i$ is the time when the p/He flux ratio deviates from the average $a_i$, and $b_i$ is the slope of the time variation. Above 3.29 GV, the p/He flux ratio is consistent with a constant value at the 95% confidence level. This shows the universality of the solar modulation of cosmic ray nuclei at relativistic rigidities. Below 3.29 GV, the observed p/He flux ratio is steadily decreasing with time after $t_i$. In the first five rigidity bins, the best fit values of $t_i$ are in agreement with each other. Their average value is equal to February 28, 2015 with an accuracy of $\pm42$ days, consistent with boundary VII of Figure 2, after which the proton and helium fluxes start to increase. This last observation shows a new and important feature regarding the propagation of lower energy cosmic rays in the heliosphere. The precision of the AMS data provides information for the development of refined solar modulation models.
In conclusion, the precision proton flux and the helium flux observed by AMS have fine time structures nearly identical in both time and relative amplitude. The amplitudes of the flux structures decrease with increasing rigidity and vanish above 40 GV. The amplitudes of the structures are reduced during the time period, which started one year after solar maximum, when the proton and helium fluxes steadily increase. In addition, above ∼3 GV the p/He flux ratio is time independent. Below ∼3 GV the ratio has a long-term decrease coinciding with the period during which the fluxes start to rise.