Improvements in Determination of Tracker Absolute Rigidity Scale and Tracker Alignment
In AMS, for all Z, the largest systematic error in the determination of the fluxes at the highest energies is due to the uncertainty of the absolute rigidity scale. The AMS tracker was aligned using the CERN SPS test beam. In beam tests, AMS was exposed to beams of positrons and electrons in the momentum range from 10 to 290 GeV/c, beams of protons and pions from 10 to 180 GeV/c, and to the 400 GeV/c proton beam. To simulate the arrival of cosmic rays at AMS in space, the test beams were injected in a variety of positions and directions. These data allowed the tracker to be aligned and the determination of the absolute rigidity scale, as shown in Charge Sign Identification. Vibrations and accelerations during the AMS launch into space, as well as outgassing of the carbon fiber supporting structure in vacuum, could have changed the ladder positions of the inner tracker at the sub-micron level, and may therefore cause shifts in the absolute rigidity scale. Note, a coherent shift in the inner tracker layers of less than 0.5 microns is sufficient to create an absolute rigidity scale shift of 1/10 $\mathrm{TV^{-1}}$.
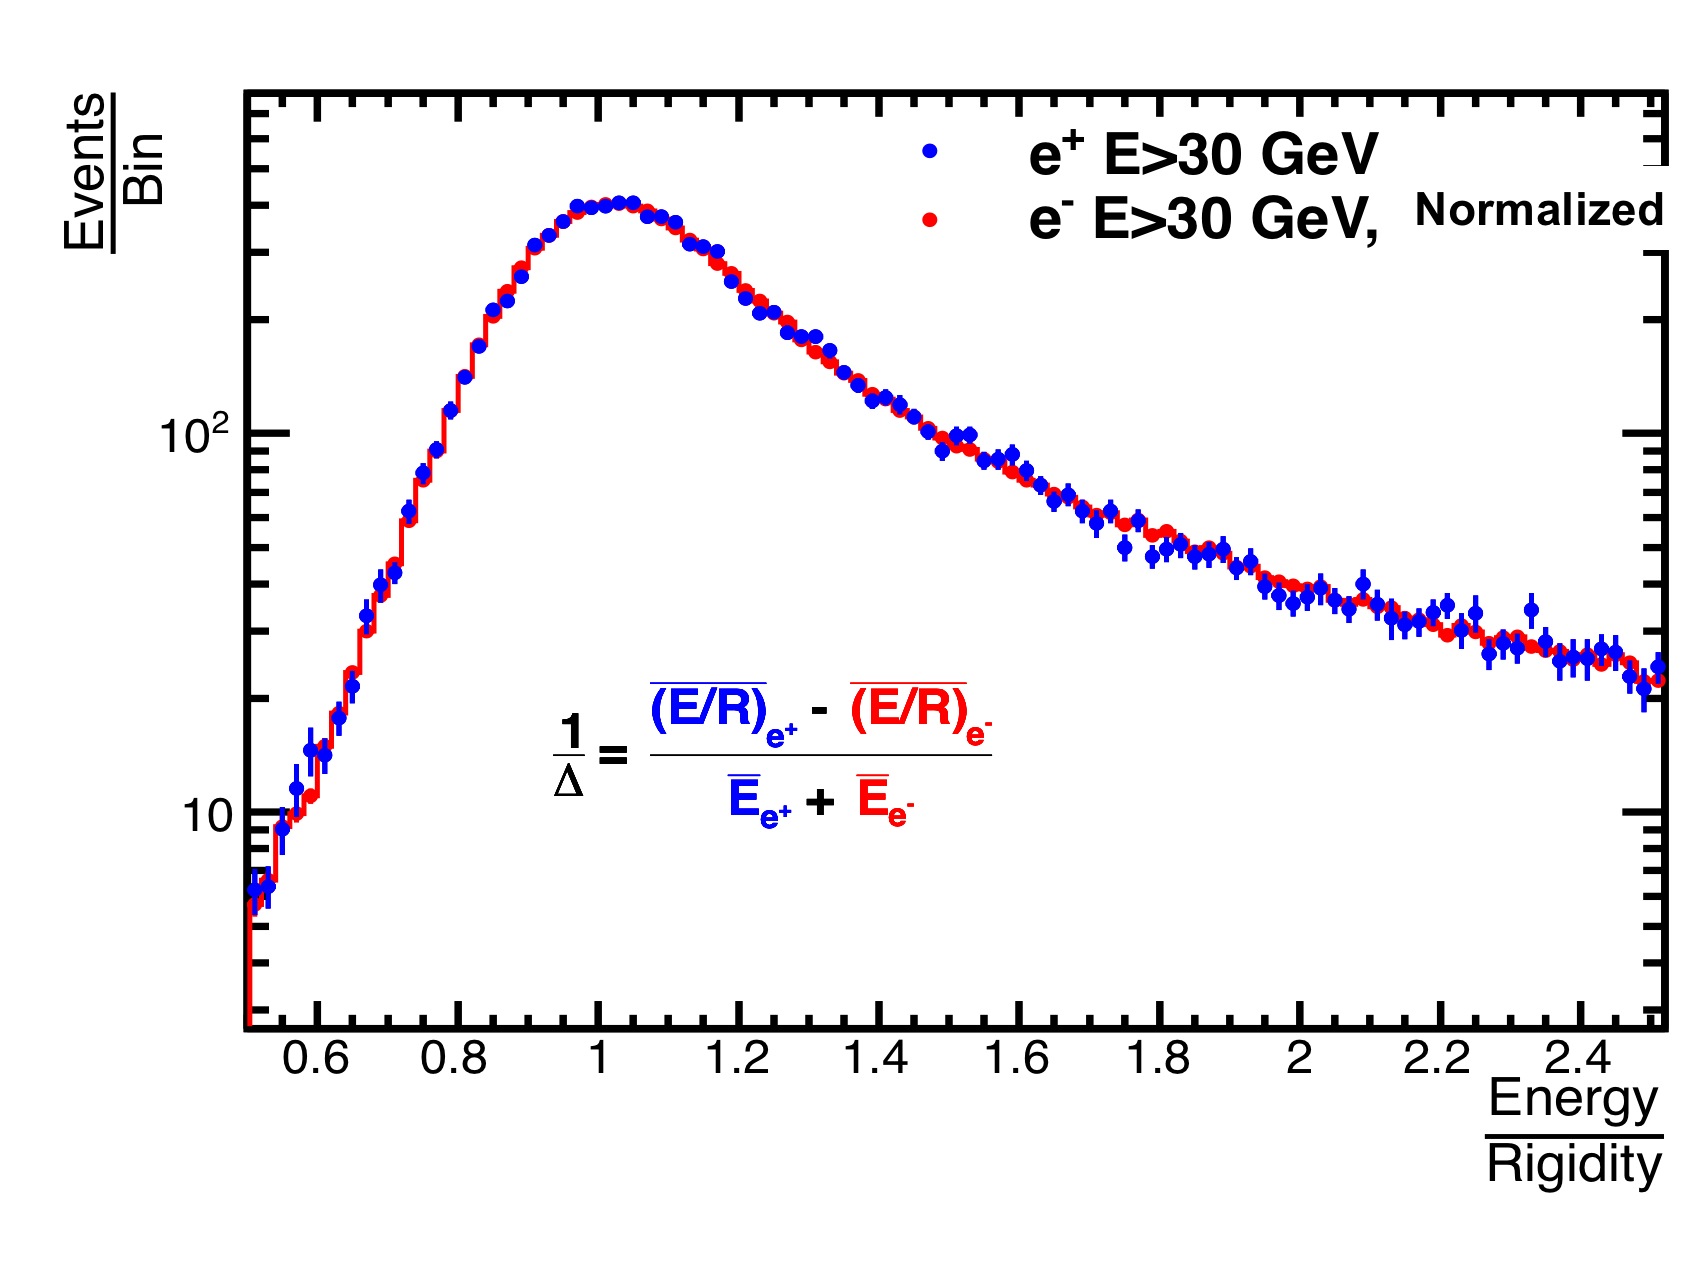
The rigidity scale shift, $1/\Delta$, of the AMS tracker in space was measured previously by comparing the $E/R$ distributions, where $E$ is the energy measured by the ECAL and $R$ is the rigidity measured by the tracker for electrons and positrons with energy > 30 GeV, as shown in Figure 1. The absolute rigidity scale shift was determined to be $1/\Delta = 0 \pm 0.050$ $\mathrm{TV^{-1}}$.
In order to reduce the error on the tracker rigidity scale, a new method has been developed to perform the evaluation of the rigidity scale shift systematically as a function of energy of electrons and positrons. It yields $1/\Delta = 0 \pm 0.033$ $\mathrm{TV^{-1}}$
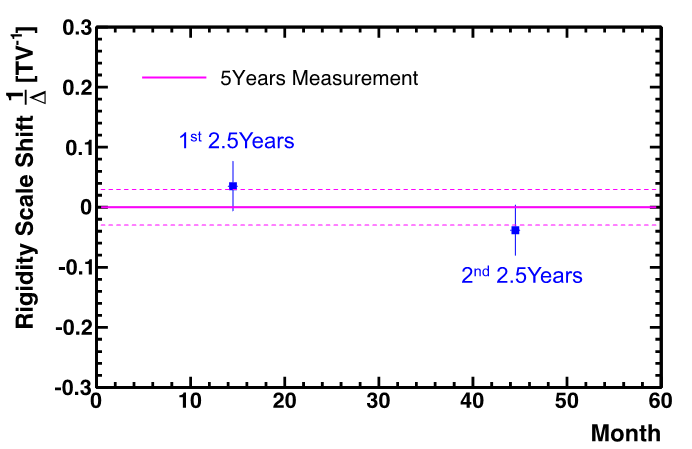
To check the stability of the rigidity scale with time, the data from the first 5 years of operations was divided in half. The entire procedure was repeated on these two samples. Relative to the 5-year rigidity scale, the estimated rigidity scale of the first half was found to be $1/\Delta_{1} = 0.035 \pm 0.043$ $\mathrm{TV^{-1}}$ and of the second half to be $1/\Delta_{2} = −0.038\pm0.044$ $\mathrm{TV^{-1}}$, as shown in Figure 2. As seen, the two samples are statistically consistent with the complete data set and there is no systematic shift over time.
The positions of L1 and L9 are dynamically aligned every 2 minutes according to extrapolations from the inner tracker (layers L2 to L8). Therefore, the rigidity scale of the full span tracker with layers from L1 to L9 is expected to follow the rigidity scale of the inner tracker. To verify this, the difference in the rigidity scales shift between the full span tracker and the inner tracker, $1/\Delta(1/R_{19}) – 1/\Delta(1/R_{28})$, has been estimated using high energy cosmic ray proton and helium events. Both proton and helium samples yield similar results. Figure 3 shows the results for the helium sample.
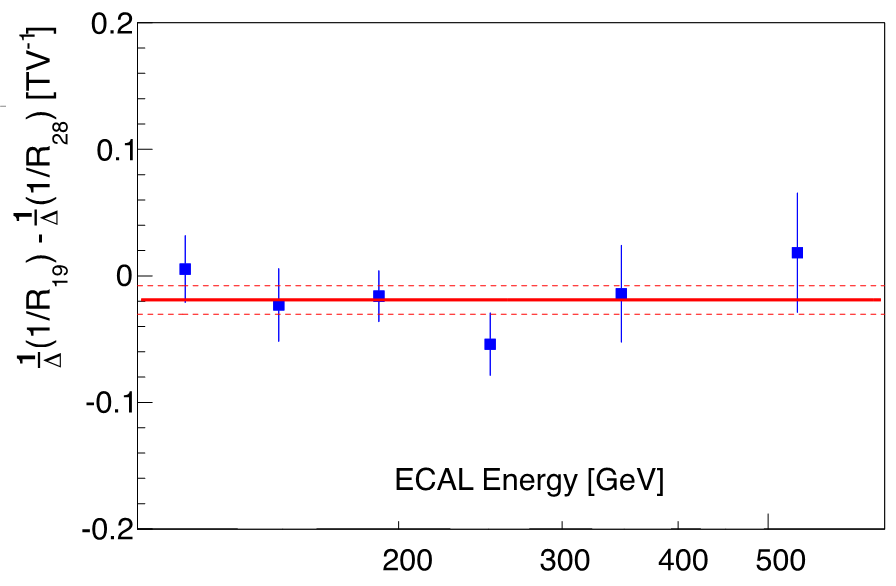
The difference was found to be $1/\Delta(1∕R_{19} ) − 1/\Delta(1∕R_{28}) = −0.019 \pm 0.011$ $\mathrm{TV^{-1}}$, independent of rigidity. The corresponding small shifts in the L1 and L9 positions were corrected and the error of 0.011 $\mathrm{TV^{-1}}$ was added in quadrature to the total error of the rigidity scale.
Overall, the tracker rigidity scale was measured with an accuracy of $\pm0.034$ $\mathrm{TV^{-1}}$, limited mostly by positron statistics. This corresponds to the determination of the coherent displacement of the L2-L8 layers by less than 0.2 microns.
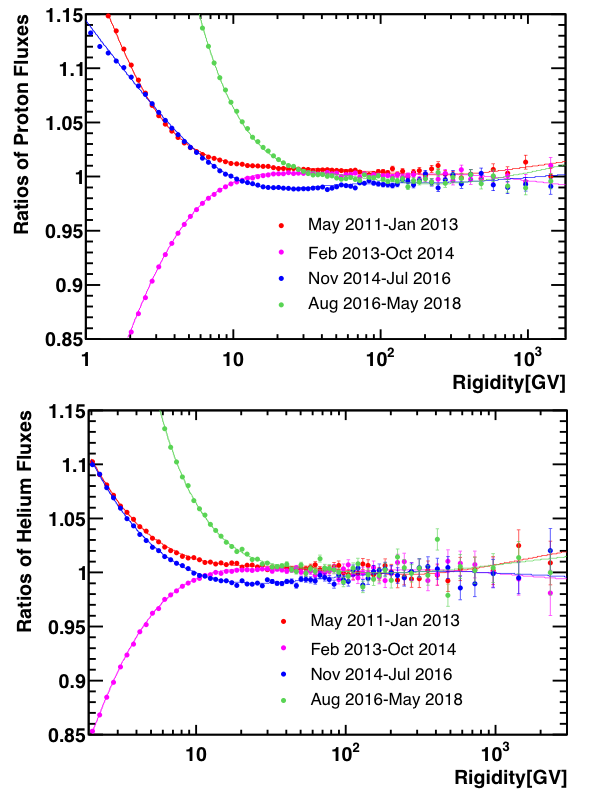
Recently, the rigidity scale measurement was extended to include the full 7 years of AMS data. To verify that these rigidity scale corrections are time independent, we have studied the time dependence of the measured fluxes. Figure 4(a) shows the ratio of the proton flux measured using data from each 21-month period to the flux measured over the complete 7 years. Figure 4(b) shows the same ratio for the helium flux.
