Towards Understanding the Origin of Cosmic-Ray Electrons
We present the precision measurement of the electron flux with a particular emphasis on the behavior at high energies. The measurement is based on 28.1 million electron events collected by AMS from May 19, 2011 to November 12, 2017. This corresponds to a factor of three increase in statistics and factor of two increase in the energy range compared to our results published in 2014 [PRL 113, 121102 (2014)]. The latest precision results on cosmic-ray electrons up to 1.4 TeV reveal new and unexpected features. Our latest data on cosmic-ray electrons and positrons are crucial for providing insights into origins of high energy cosmic-ray electrons and positrons.
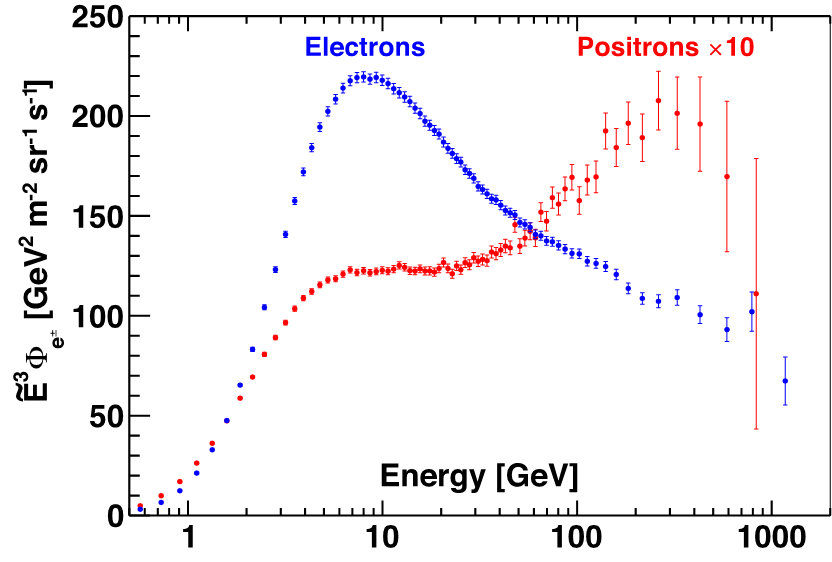
We found that in the entire energy range the electron and positron spectra have distinctly different magnitudes and energy dependences. The electron flux exhibits a significant excess starting from $ 42.1_{-5.2}^{+5.4} $ GeV compared to the lower energy trends, but the nature of this excess is different from the positron flux excess above $25.2 \pm 1.8$ GeV. Contrary to the positron flux, which has an exponential energy cutoff of $810_{-180}^{+310} $
Figure 1 shows the latest AMS results on the precision measurements of the electron spectrum and the positron spectrum from the most recent AMS data. These measurements are based on 28.1 million electron and 1.9 million positron events.
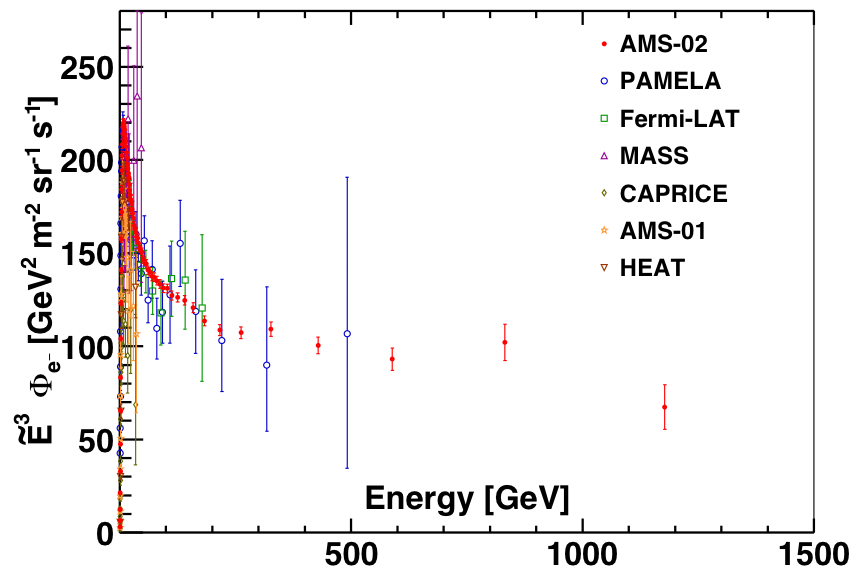
Figure 2 shows the latest AMS results on the precision measurements of the electron spectrum. The other most recent measurements are shown for comparison.
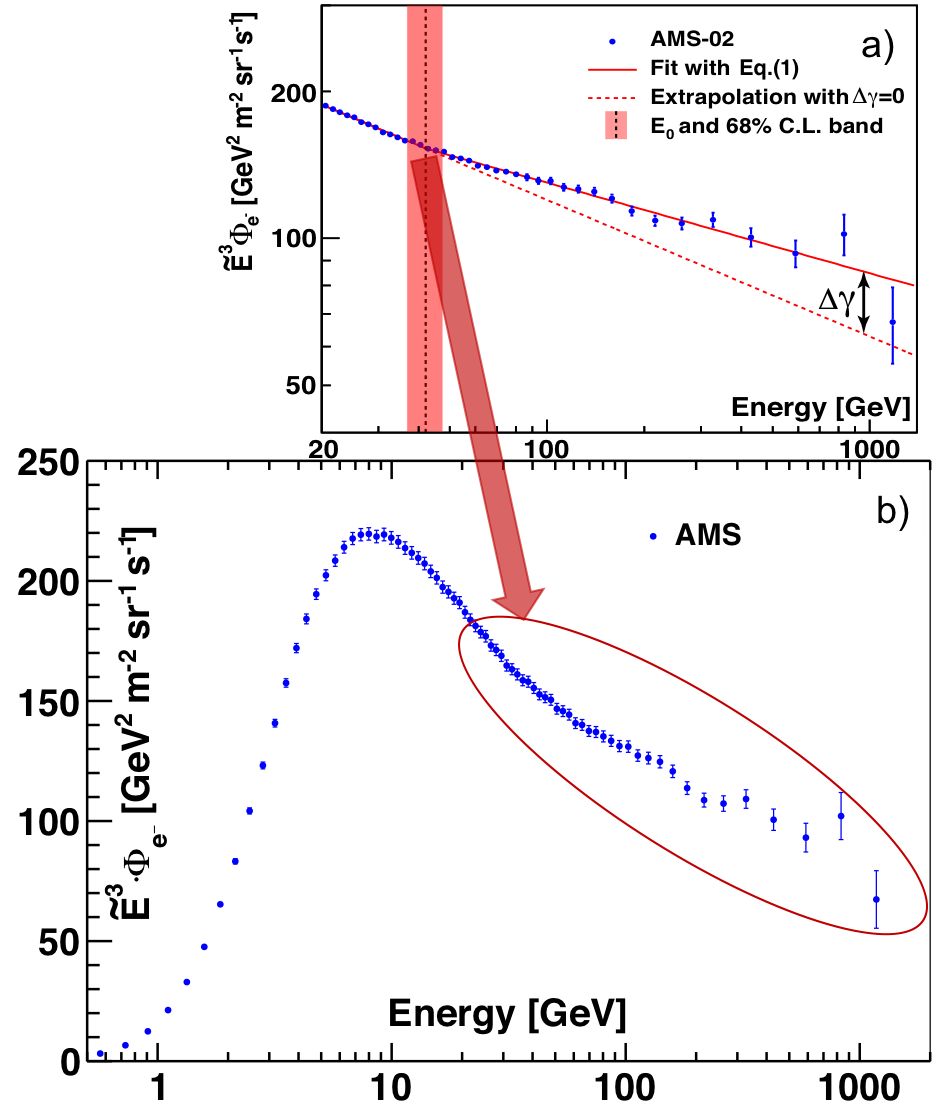
Similar to the analysis of the positron flux, we examine the changing behavior of the electron spectrum using the same power law approximation
$$ \label{eq:1} \Phi_{e^{-}}(E)= \begin{cases} C(E/20.04\mbox{ GeV})^{\gamma}, & E \leq E_{0}; \\ C(E/20.04\mbox{ GeV})^{\gamma}(E/E_{0})^{\Delta\gamma}, & E > E_{0}. \end{cases} \tag{1} $$
A fit to data is performed in the energy range [20.04−1400] GeV. The results are presented in Figure 3. The fit yields $E_{0} = 42.1_{-5.2}^{+5.4}$ GeV for the energy where the spectrum behavior changes. The significance of this change is established at 7σ.
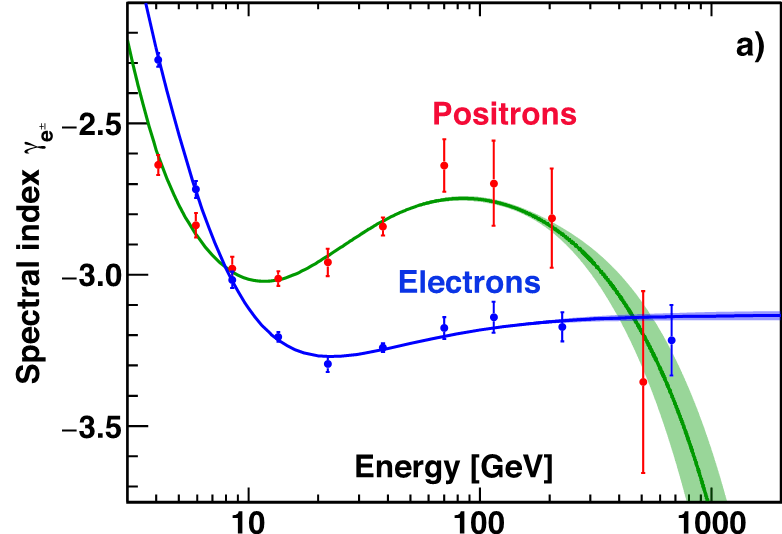
To examine the energy dependence of the electron flux in a model independent way, the flux spectral index $\gamma$ is calculated from $\gamma = d[\log(\Phi)]/d[\log(E)]$ over non-overlapping energy intervals which are chosen to have sufficient sensitivity to the spectral index. The energy interval boundaries are 3.36, 5.00, 7.10, 10.32, 17.98, 27.25, 55.58, 90.19, 148.81, 370 and 1400 GeV. The results are presented in Figure 4 together with the positron results. As seen, both the electron and positron indices decrease (soften) rapidly with energy below ∼10 GeV, and then they both start increasing (harden) at >20GeV. In particular, the electron spectral index increases from $\gamma = −3.295\pm0.026$ in the energy range [17.98 − 27.25] GeV to an average $\gamma = −3.180\pm0.008$ in the range [55.58 − 1400] GeV, where it is nearly energy independent.
As seen in Figure 4, the behavior of the electron and positron spectral indices is distinctly different.
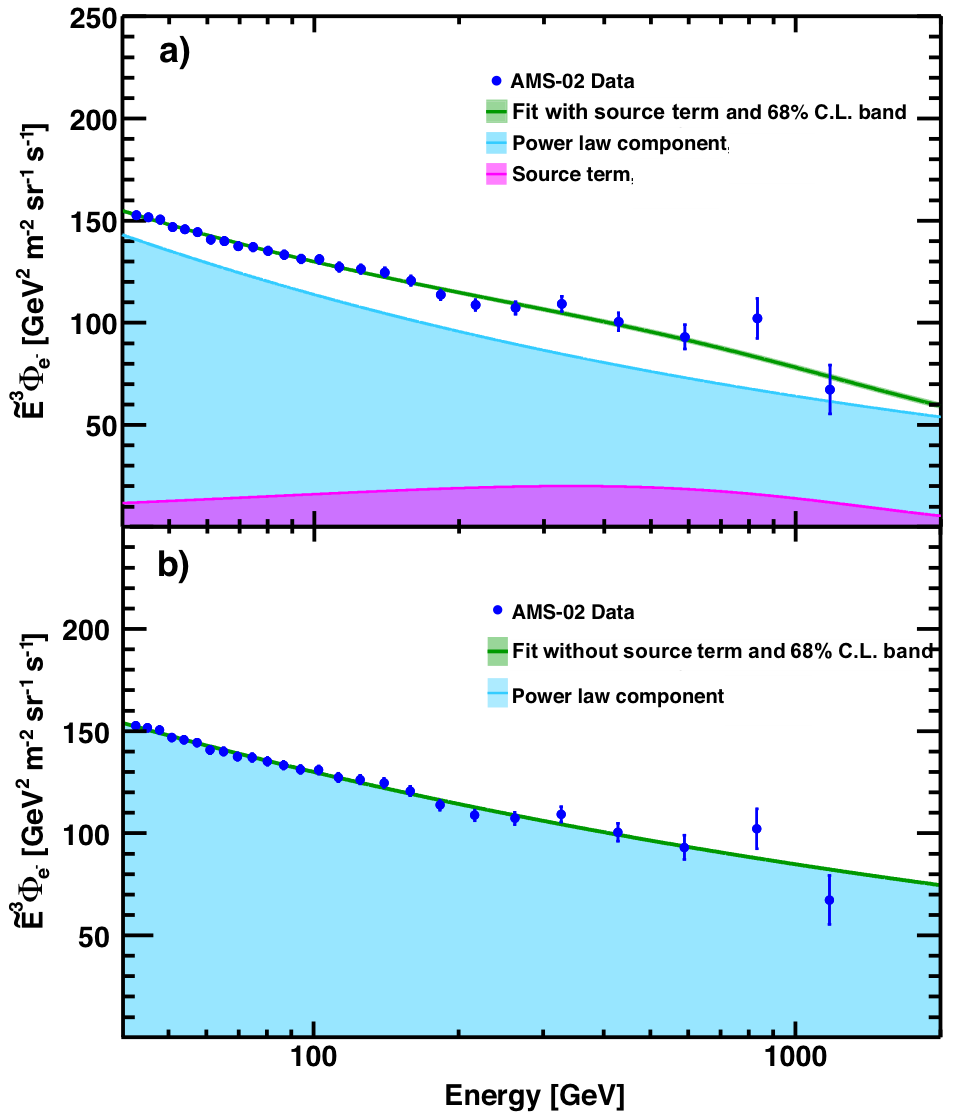
New sources of high energy positrons, such as dark matter, may also produce an equal amount of high energy electrons. We test this hypothesis using the source term from our positron analysis. The electron flux is parametrized as a sum of a power law component and the positron source term with the exponential energy cutoff:
$$ \label{eq:2} \Phi_{e^{-}}(E)= C_{e^{-}}(E/E_{1})^{\gamma_{e^{-}}} + f_{e^{-}}C_{S}^{e^{+}}(E/E_{2})^{\gamma_{S}^{e^{+}}}\exp(-E/E_{S}^{e^{+}}) \tag{2} $$
The power law component is characterized by the normalization factor $C_{e^{-}}$ and the spectral index $\gamma_{e^{-}}$ . The constant $E_1= 41.61$ GeV corresponds to the beginning of the fit range, it does not affect the fitted value of $\gamma_{e^{-}}$ . The values of the source term parameters $C_{S}^{e^{+}}$, $\gamma_{S}^{e^{+}}$, $E_2$ , and $E_{S}^{e^{+}}$ are taken from positron data. A fit to the data with the source term normalization $f_{e^{−}}$ fixed to 1 is performed in the energy range [41.61 − 1400] GeV, where the solar modulation effects are negligible. It yields $C_{e^{-}} = (1.965 \pm 0.010) \times 10^{−3} [ \mathrm{m^{2}\,sr\,s\,GeV}]^{-1}$ and $\gamma_{e^{-}} = −3.248 \pm 0.007$ for the power law component with $\chi^2/\mathrm{d.o.f.} = 15.5/24$. The result of the fit is presented in Figure 5(a).
A similar fit of Eq. (\ref{eq:2}) to data, but with $f_{e^{-}}$ fixed to 0, yields $C_{e^{-}} = (2.124 \pm 0.010) \times 10^{−3} [\mathrm{m^{2}\,sr\,s\,GeV}]^{-1}$ and $\gamma_{e^{-}} = −3.186 \pm 0.006$ with $\chi^2/\mathrm{d.o.f.} = 15.2/24$. The result of this fit is presented in Fig. 5(b). Varying the normalization of the source term $f_{e^{-}}$ as a free fit parameter does not improve the $\chi^2$ and yields $f_{e^{-}} = 0.5_{-0.6}^{+1.2}$ . As seen in Figures 5 (a) and (b) the data are consistent both with the charge symmetric positron source term ($f_{e^{-}} = 1$ in Eq. (\ref{eq:2})) and also with the absence of such a term ($f_{e^{-}} = 0$). Therefore, it is not possible to extract any additional information on the existence and properties of the source term with the electron flux.
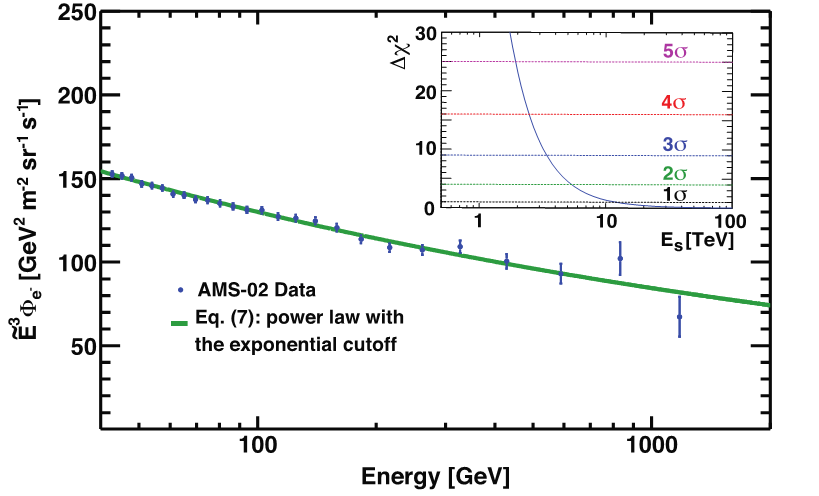
To investigate the existence of a finite energy cutoff as seen in the positron flux, the electron flux is fitted with
$$ \label{eq:3} \Phi_{e^{-}}(E)= C_{S}(E/41.61\mbox{ GeV})^{\gamma_{S}}\exp(-E/E_{S}) \tag{3} $$
A fit to data in the energy range [41.61, 1400] GeV yields the inverse cutoff energy $1/E_{s} = 0.00_{-0.00}^{+0.08}$ TeV−1 with $\chi^2/\mathrm{d.o.f.} = 15.2/23$. A study of the cutoff significance shows that $E_{s} < 1.9$ TeV is excluded at the 5σ level. These results are presented in Figure 6.
In addition to a small contribution of secondary electrons produced in the collisions of ordinary cosmic rays with the interstellar gas, there are several astrophysical sources of primary cosmic-ray electrons. It is assumed that there are only a few astrophysical sources of high energy electrons in the vicinity of the solar system each making a power law-like contribution to the electron flux. In addition, there are several physics effects which may introduce some spectral features in the original fluxes. Therefore, it is important to know the minimal number of distinct power law functions needed to accurately describe the AMS electron flux.
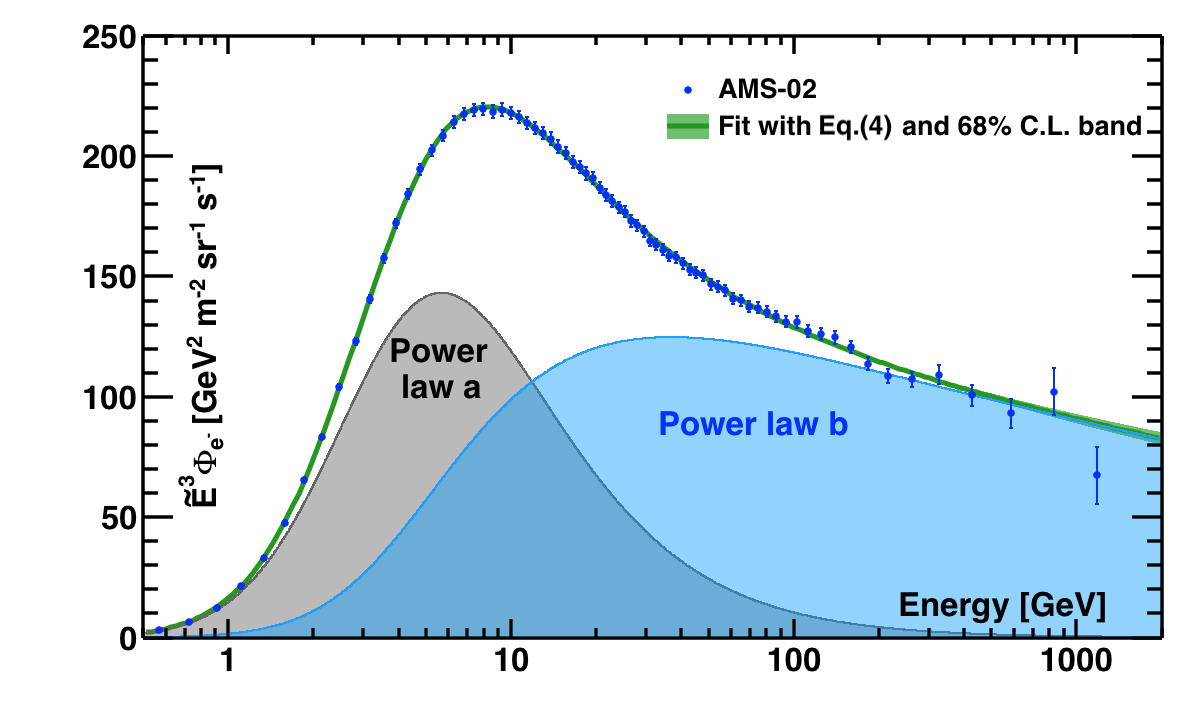
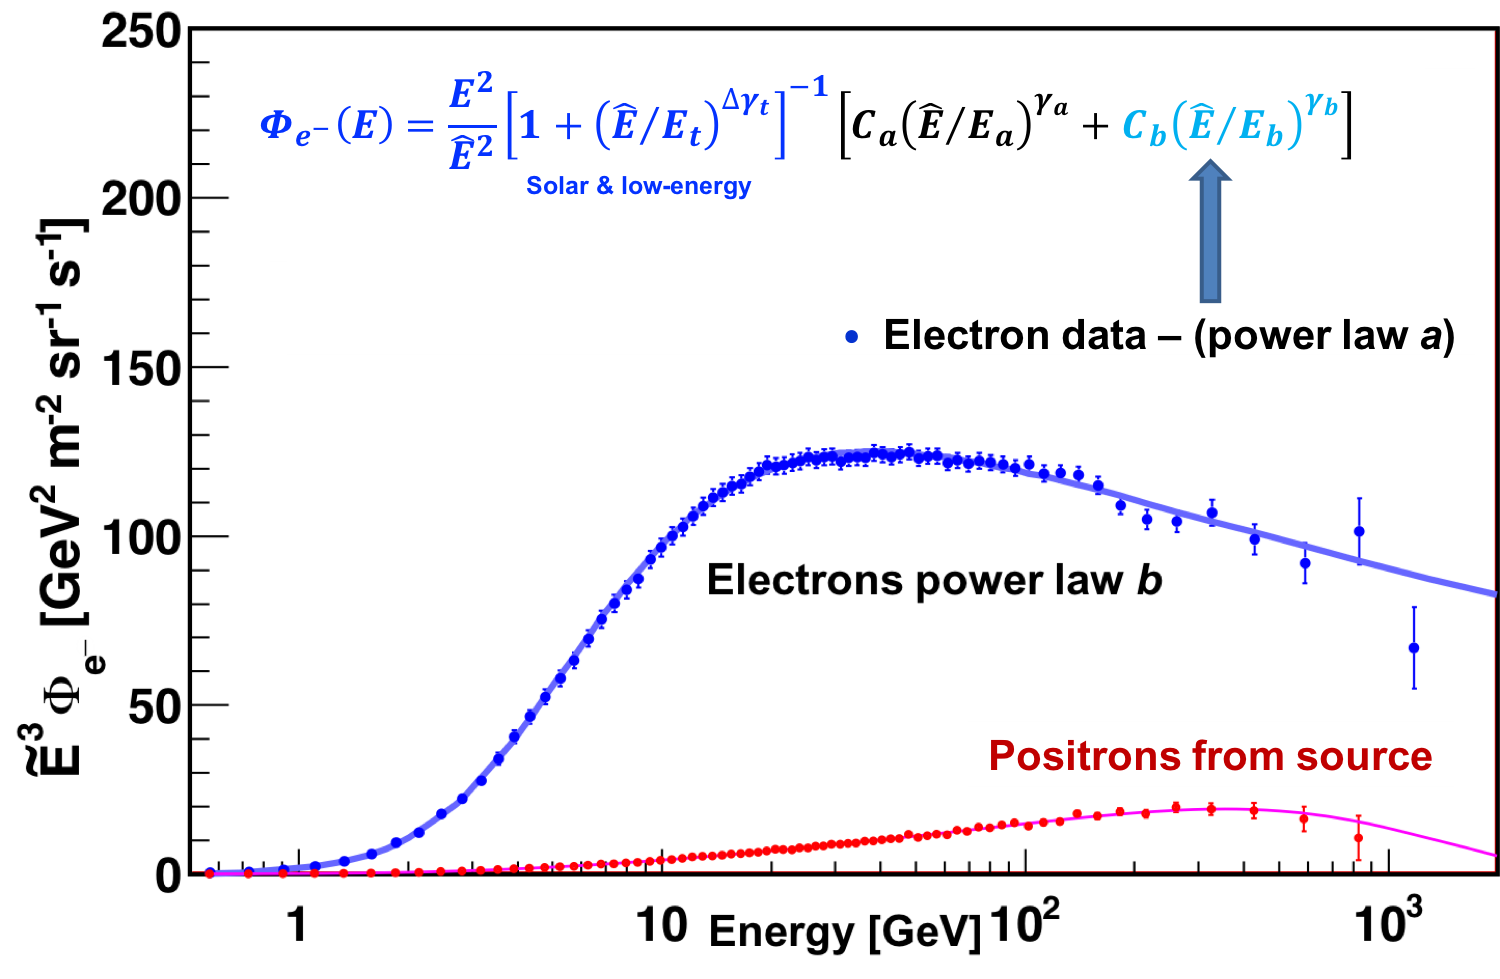
We found that in the entire energy range [0.5 − 1400] GeV the electron flux is well described by the sum of two power law components:
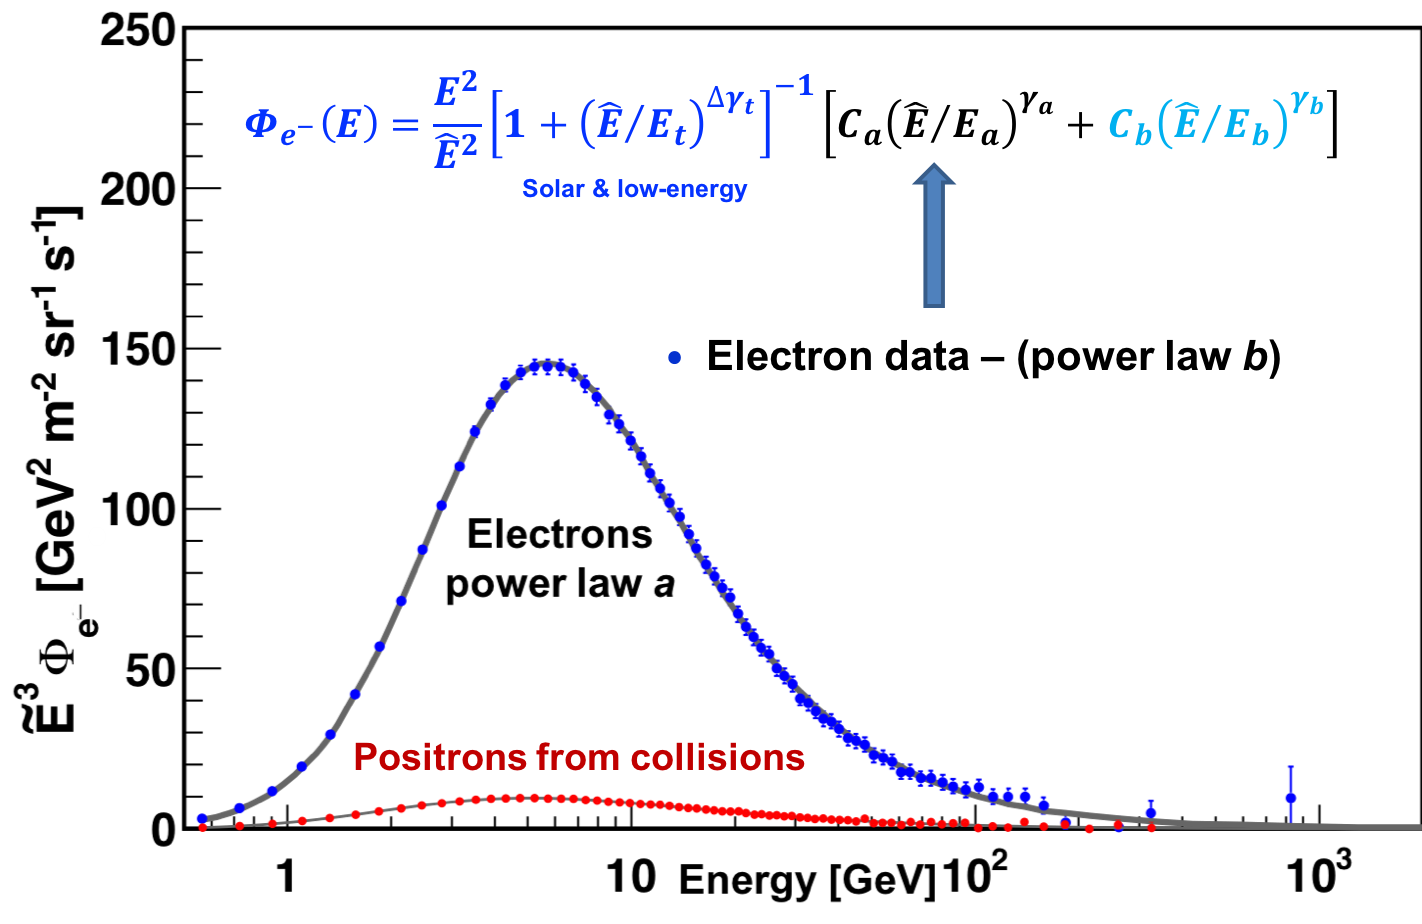
$$ \label{eq:4} \Phi_{e^{-}}(E)= \dfrac{E^{2}}{\hat{E}^{2}}[1+(\hat{E}/E_{t})^{\Delta\gamma_{t}}]^{-1}[C_{a}(\hat{E}/E_{a})^{\gamma_{a}}+C_{b}(\hat{E}/E_{b})^{\gamma_{b}}] \tag{4} $$
The two components, $a$ and $b$, correspond to two power law functions. To account for solar modulation effects, the force-field approximation is used, with the energy of particles in the interstellar space $\hat{E}=E+\varphi_{e^{-}}$ and the effective modulation potential $\varphi_{e^{-}}$. The additional transition term, $[1+(\hat{E}/E_{t})^{\Delta\gamma_{t}}]^{-1}$, has vanishing impact on the flux behavior at energies above $E_{t}$ (e.g. < 0.7% above 40 GeV). A fit to the data in the energy range [0.5−1400] GeV is presented in Figure 7. We conclude that in the energy range [0.5 − 1400] GeV the sum of two power law functions provides an excellent description of the data with $\chi^{2}/\mathrm{d.o.f.} = 36.5/68$.
An analysis of the individual components in the electron flux, namely the power law $a$ and $b$ terms, is presented in Figures 8 and 9 together with the corresponding positron data. As seen in Figure 8, at low energies positrons come from cosmic ray collisions, electrons do not. As seen in Figure 9, the positron source term has a cutoff, whereas electrons have neither the source term nor the cutoff.
In the entire energy range the electron and positron spectra have distinctly different magnitudes and energy dependences. The different behavior of the cosmic-ray electrons and positrons measured by AMS is clear evidence that most high energy electrons originate from different sources than high energy positrons.