Towards Understanding the Origin of Cosmic-Ray Positrons
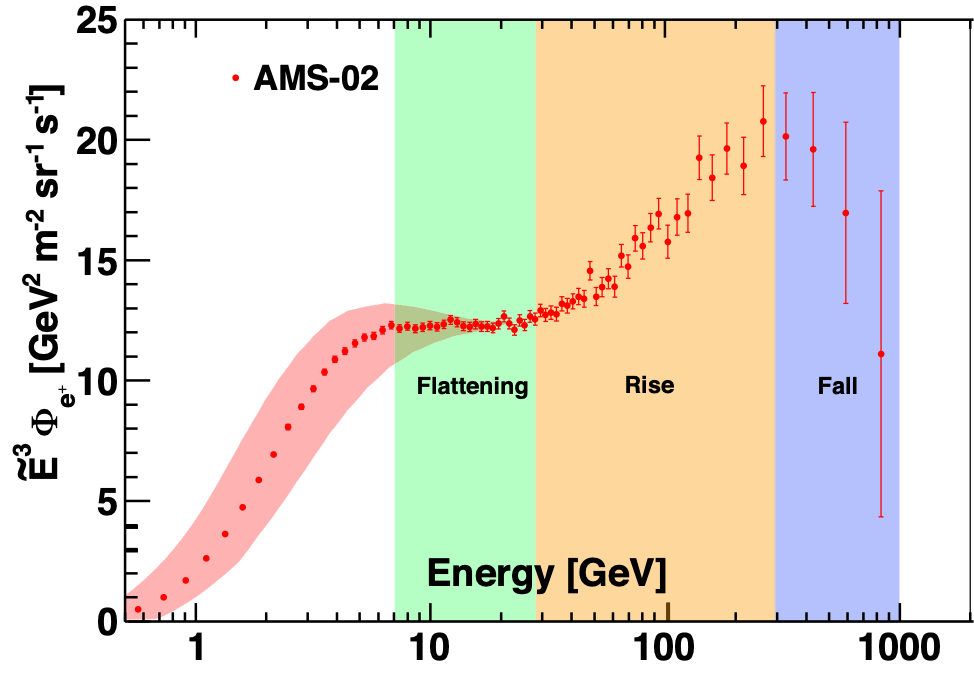
Studies of light cosmic ray antimatter species, such as positrons, antiprotons, and antideuterons, are crucial for the understanding of new phenomena in the cosmos, since the yield of these particles from cosmic ray collisions is small. Our data published in 2013 and 2014 have generated widespread interest and discussions of the observed excess of high energy positrons. The explanations of these results included three classes of models: annihilation of dark matter particles, acceleration of positrons to high energies in astrophysical objects, and production of high energy positrons in the interactions of cosmic ray nuclei with interstellar gas. Most of these explanations differ in their predictions for the behavior of cosmic ray positrons at high energies. With the high statistics data sample of cosmic ray positrons, we performed new precise measurements of positrons up to 1 TeV and analyze the observation of changing behavior of the cosmic ray positron flux. These experimental results are crucial for understanding the origin of high energy positrons in the cosmos. The measurement (see Figure 1) is based on 1.9 million positrons collected by AMS from May 19, 2011 to November 12, 2017. This corresponds to a factor of three increase in statistics and factor of two increase in energy range compared to our earlier results [PRL 113, 121102 (2014)]. Note, that with precise knowledge of the detector acceptance for electrons and positrons, the positron flux, $Φ_{e^{+}}$, is more sensitive to new physics phenomena than the positron fraction, $Φ_{e^{+}}/(Φ_{e^{+}}+Φ_{e^{-}})$, since it is independent of the energy dependence of electrons.
The positron flux exhibits complex energy dependence. Its distinctive properties are:
- a significant excess starting from $25.2 \pm 1.8$ GeV compared to the lower-energy, power-law trend;
- a sharp drop-off above $284_{-64}^{+91}$ GeV;
- in the entire energy range the positron flux is well described by the sum of a term associated with the positrons produced in the collision of cosmic rays, which dominates at low energies, and a new source term of positrons, which dominates at high energies; and
- a finite energy cutoff of the source term of $E_{s} = 810_{-180}^{+310}$ GeV is established with a significance of more than 4σ.
These experimental data on cosmic ray positrons show that, at high energies, they predominantly originate either from dark matter annihilation or from other astrophysical sources.
Figures from 1 to 11 summarize this previously unobserved behavior. $\tilde{E}$ is the spectrally weighted mean energy for a flux proportional to $E^{-3}$.
In-depth studies of the detector performance have been performed for this analysis. These studies include the tracker resolution at rigidities close to the maximum detectable rigidity of 2 TV, charge confusion studies, track finding efficiency improvements, reconstruction of electromagnetic showers in the TeV energy range, and proton rejection with the electromagnetic calorimeter. In addition to these studies, exhaustive verifications of the results were performed including different analysis methods and by tightening the selection criteria that allow us to achieve a high purity positron sample.
An example of the stability of the results is demonstrated with an analysis, which aims at a higher signal/background ratio using a tighter cut on the ECAL information. In this analysis the proton rejection is increased by a factor ~3 compared to the published analysis. This tight-cut analysis has a signal efficiency of 65% instead of the nominal 90%. The results of this tight selection analysis do not alter the flux value as presented in Figure 2 for the last five energy bins.
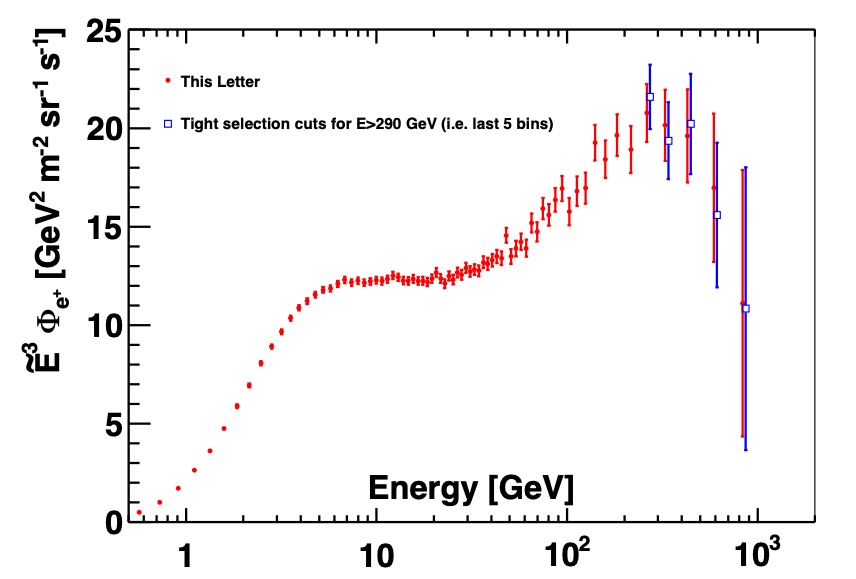
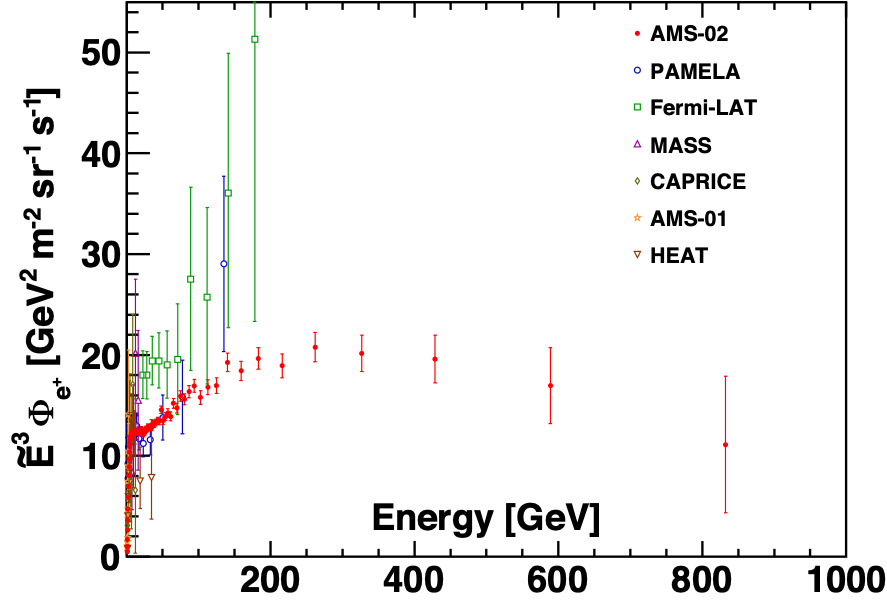
Figure 3 shows the AMS result together with earlier experiments: PAMELA, Fermi-LAT, MASS, CAPRICE, AMS-01, and HEAT. The new AMS data significantly extend the measurements into the uncharted high energy region.
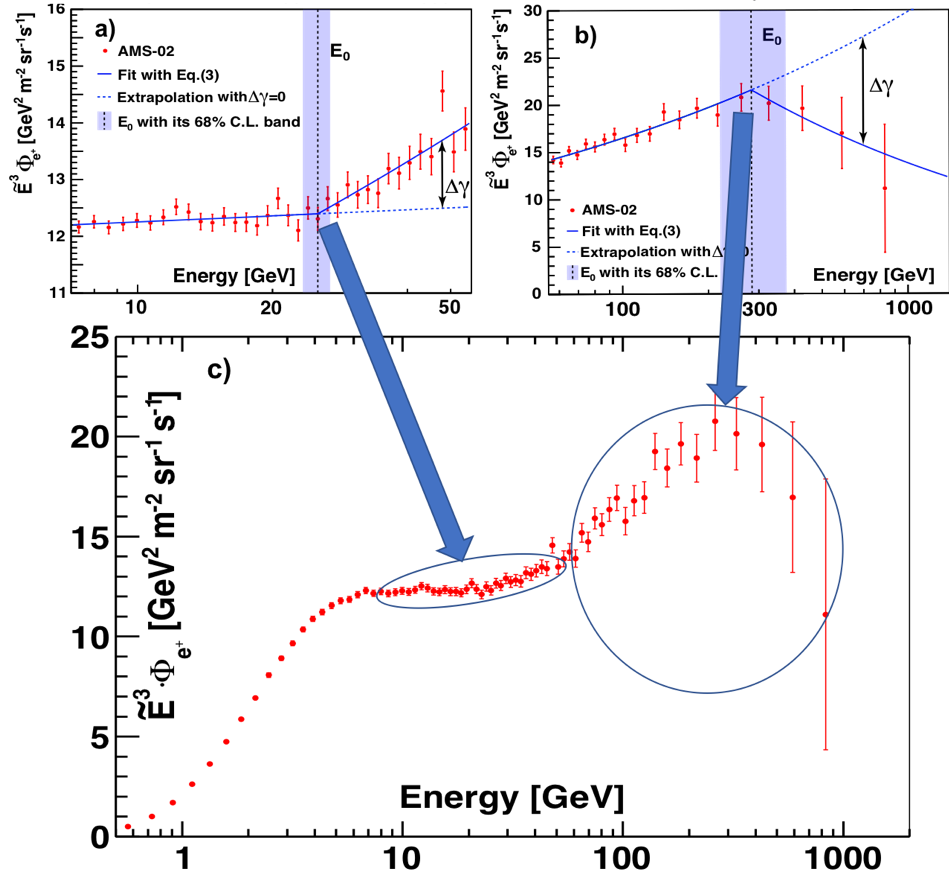
To examine the changing behavior of the positron spectrum highlighted in Figure 1 by the vertical color bands, we use a power law approximation:
\begin{equation}
\Phi_{e^{+}}(E)=
\begin{cases}
C(E/55.58\mbox{ GeV})^{\gamma}, & E \leq E_{0}; \\
C(E/55.58\mbox{ GeV})^{\gamma}(E/E_{0})^{\Delta\gamma}, & E > E_{0}.
\end{cases}
\label{eq:1}
\end{equation}
Fits to data are performed in two energy ranges: [7.10−55.58] GeV and [55.58 − 1000] GeV. The first range corresponds to the increase of the spectrum (hardening), while the second range corresponds to the spectrum decrease (softening). The results are presented in Figure 4. The fit in the range [7.10−55.58] GeV yields $E_{0} = 25.2 \pm 1.8$ GeV for the energy where the spectrum increases. The significance of this increase is established at more than 6σ. The fit in the energy range [55.58 − 1000] GeV yields $E_{0} = 284_{-64}^{+91}$ GeV for the energy at which the spectrum begins to decrease. The significance of this decrease is established at more than 3σ.
The complex behavior of the positron flux (as illustrated in Figure 4) is consistent with the existence of a new source of high energy positrons with a characteristic cutoff energy, whether of dark matter or other astrophysical origin. It is not consistent with the exclusive secondary production of positrons in collisions of cosmic rays.
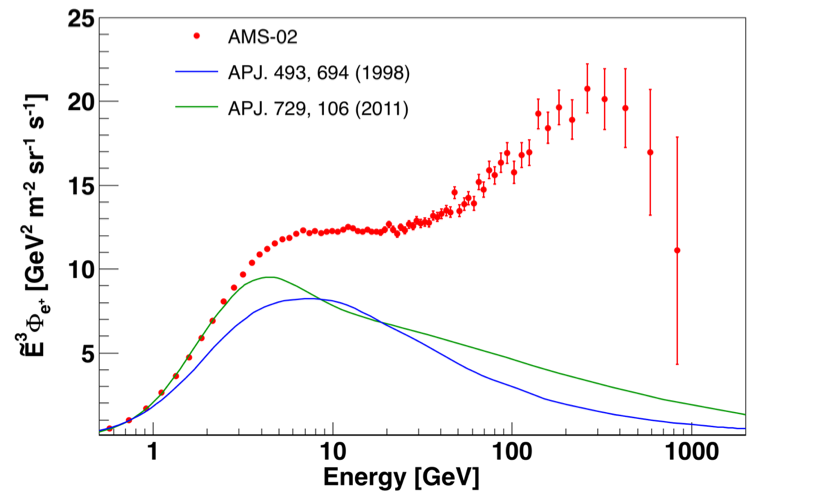
There are many models predicting the secondary positrons. They differ in the underlying assumptions and the predictions for the positron flux near Earth. Among these models, GALPROP is widely regarded as a standard framework for prediction of fluxes of secondaries based on the data from accelerator experiments and from cosmic-ray studies. In Figure 5 two GALPROP predictions are shown. As seen, even in the framework of a single model (i.e. GALPROP), there is a wide range of the predictions for the secondary positron flux. However, independent of the input parameter choice, GALPROP predictions show a peak in the spectrum of secondary positrons below 10 GeV and then steady decrease with the increasing energy.
The model predictions depend heavily on the choice of parameters and on the cosmic ray propagation scenarios. This is also illustrated with another model (T. Delahaye et al. A&A 524, A51 (2010)) shown in Figure 6. As seen, in this model the positron flux predictions are different by a factor of 2 to 10 in the energy range from 1 GeV to 1 TeV, but none of these predictions is consistent with the AMS measurements.
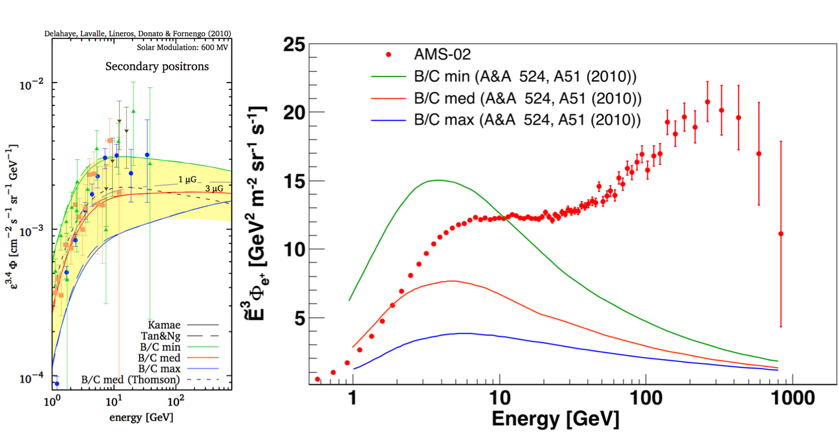
As seen, the observed rise and fall of the spectrum at high energies is not related to the models of secondary production.
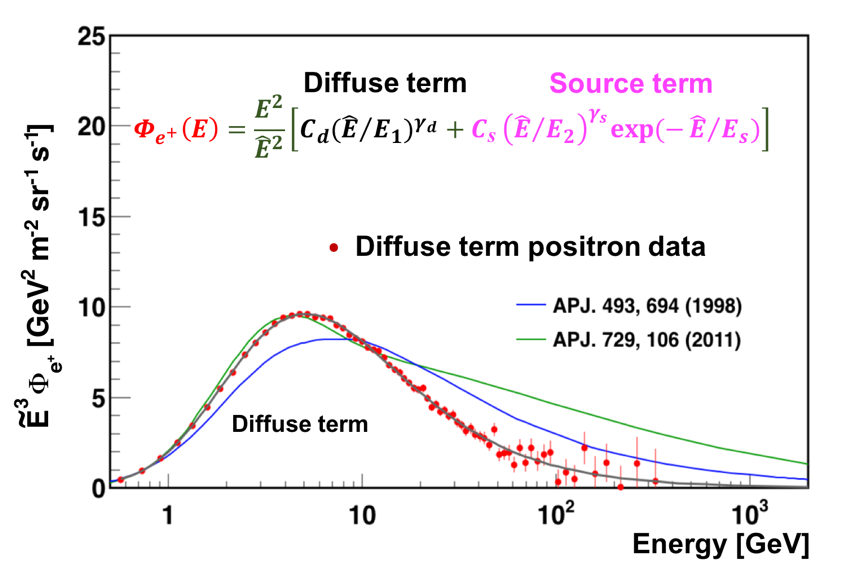
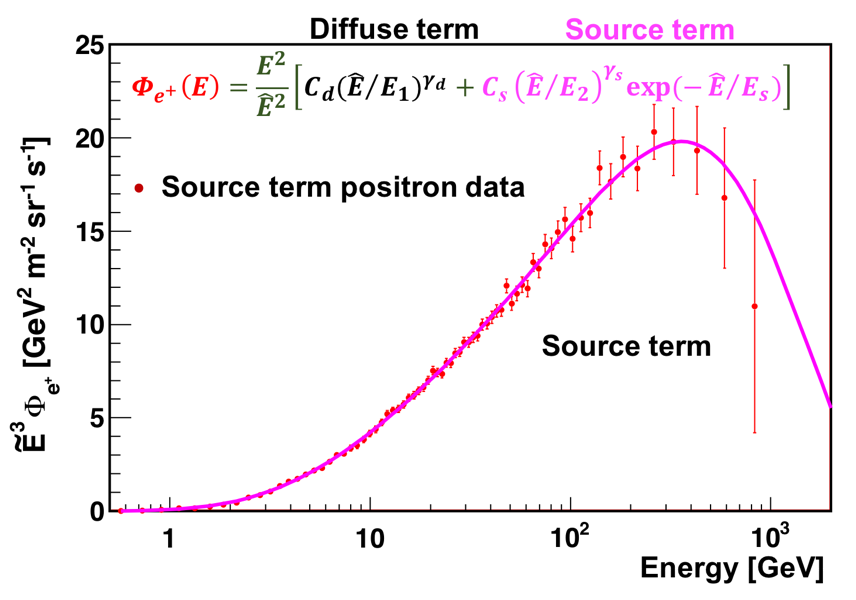
The accuracy of the AMS data allows for a detailed study of the properties of the new source of positrons up to 1 TeV. We present the analysis of the positron flux using the simplest model, in which the positron flux is parameterized as the sum of a diffuse term and a source term:
\begin{equation}
\label{eq:2}
\Phi_{e^{+}}(E) = \frac{ E^{2} }{ \hat{E} ^{2}}\big[ C_{d}( \hat{E} /E_{1})^{\gamma_{d}} + C_{s}( \hat{E} /E_{2})^{\gamma_{s}} \mbox{exp} (- \hat{E} /E_{s})\big]
\end{equation}
The diffuse term describes the low energy part of the flux dominated by the positrons produced in the collisions of ordinary cosmic rays with the interstellar gas. It is characterized by a normalization factor $C_{d}$ and a spectral index $\gamma_{d}$. The source term has an exponential cutoff, which describes the high energy part of the flux dominated by a source. It is characterized by a cutoff energy $E_{s}$, a normalization factor $C_{s}$, and a spectral index $\gamma_{s}$. In order to account for solar modulation effects, the force-field approximation is used, with the energy of particles in the interstellar space $\hat{E}=E+\varphi_{e^{+}}$, where the effective solar potential $\varphi_{e^{+}}$ accounts for the solar effects. The fit to the measured flux yields the inverse cutoff energy $1/E_{s}=1.23\pm 0.34\mbox{ TeV}^{-1}$ corresponding to $E_{s}=810^{+310}_{-180}$ GeV and $\chi^{2}/\mathrm{d.o.f.} = 50/68$. The result of the fit is presented in Figure 7.
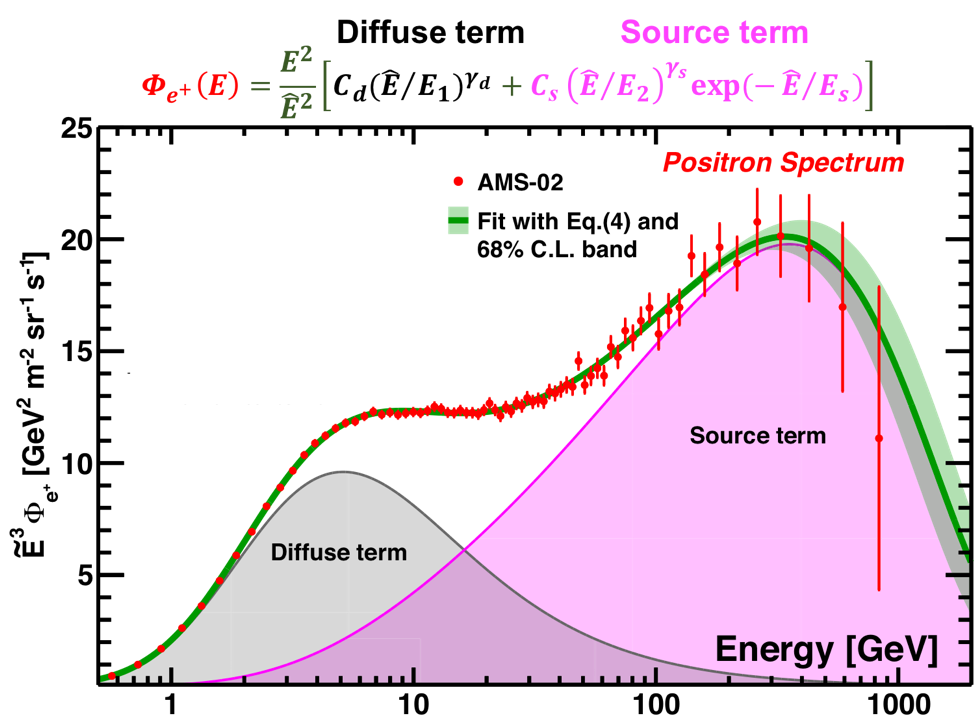
As seen in Figure 7, the diffuse term dominates at low energies and then gradually vanishes with increasing energy. The source term dominates the positron spectrum at high energies. It is the contribution of the source term that leads to the observed excess of the positron flux above $25.2 \pm 1.8$ GeV. The drop-off of the flux above $284_{-64}^{+91}$ GeV is well described by the sharp exponential cutoff of the source term.
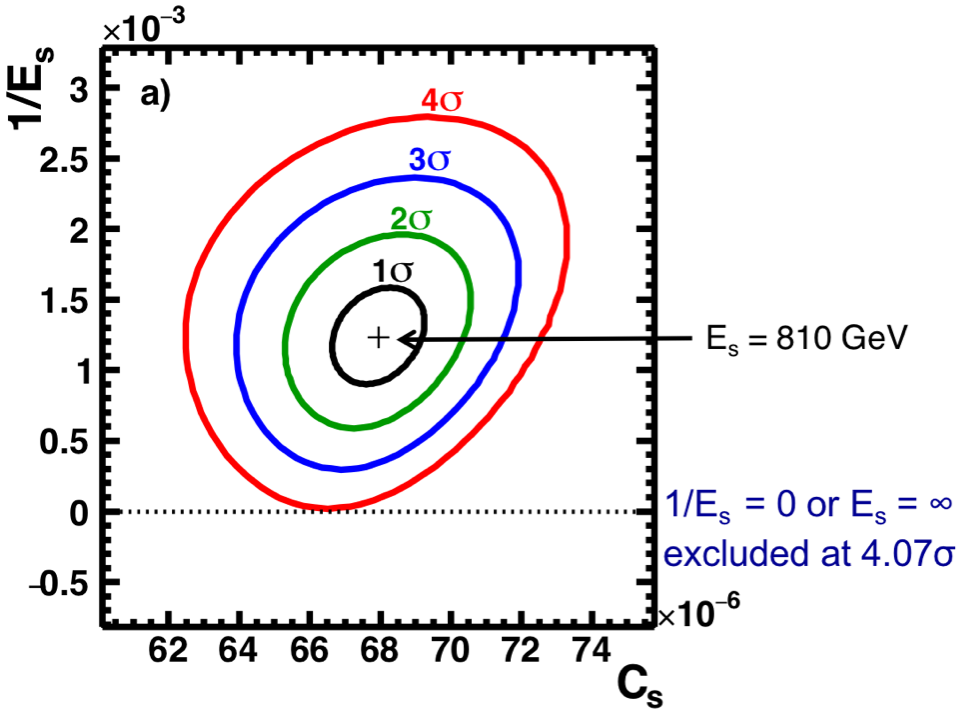
To study the significance of the cutoff energy $E_{s}$ we varied all six fit parameters to find the regions in 6D parameter space corresponding to the confidence levels from 1 to 5σ with a step of 0.01σ. As an example, Figure 8 shows projections of the 6D regions of 1σ (black line, 68.26% CL), 2σ (green line, 95.54% CL), 3σ (blue line, 99.74% CL), and 4σ (red line, 99.99% CL) onto the plane of parameters $1/E_{s}-C_{s}$. Detailed analysis shows that a point where the parameter $1/E_{s}$ reaches 0 corresponds to the confidence level of 4.07σ, i.e., the significance of the source term energy cutoff is established at more than 4σ, or at the 99.99% CL.
Analysis of the individual components, namely the diffuse term and the source term, is presented in Figures 9 and 10. As seen, positron diffuse term vanishes at high energies and can be described by the collision of cosmic rays. The source term with an exponential cutoff dominates at high energies.
The experimental data on cosmic ray positrons show that, at high energies, positrons predominantly originate either from dark matter annihilation or from other astrophysical sources.