Properties of Helium Isotopes
Helium nuclei are the second most abundant cosmic ray. They consist of two isotopes, ${^{4}\textrm{He}}$ and ${^{3}\textrm{He}}$. ${^{4}\textrm{He}}$ are thought to be mainly produced and accelerated in astrophysical sources, while ${^{3}\textrm{He}}$ are overwhelmingly produced by the collisions of ${^{4}\textrm{He}}$ with the interstellar medium. The precise knowledge of the rigidity dependences of the helium isotope fluxes and their ratio provides important information on the sources, acceleration, and propagation of cosmic rays [I. A. Grenier, J. H. Black and A. W. Strong, Annu. Rev. Astron. Astrophys. 53, 199 (2015); P. Blasi, Astron. Astrophys. Rev. 21, 70 (2013); A. W. Strong, I. V. Moskalenko, and V. S. Ptuskin, Annu. Rev. Nucl. Part. Sci. 57, 285 (2007)].
Helium (${^{3}\textrm{He}}$, ${^{4}\textrm{He}}$) interaction cross sections with the interstellar medium ($p$, He) are significantly smaller than that of heavier nuclei (Li, Be, B, C, N, O, $\dots$). Therefore, helium travel larger distances, probing a larger Galactic volume. Explicitly, the ${^{3}\textrm{He}/^{4}\textrm{He}}$ ratio probes the properties of diffusion at larger distances [G. Jóhannesson et al., Astroph. J. 824, 16 (2016)]. Moreover, ${^{3}\textrm{He}}$ is produced by the fragmentation of ${^{4}\textrm{He}}$ with the interstellar medium, whereas Li, Be, and B are produced by multiple fragmentation channels of many heavy nuclei with the interstellar medium [Y. Génolini, D. Maurin, I. V. Moskalenko, and M. Unger, Phys. Rev. C 98, 034611 (2018)]. Therefore, the ${^{3}\textrm{He}/^{4}\textrm{He}}$ flux ratio provides unique input to cosmic ray propagation models [B. Coste et al., Astron. & Astroph. 539, A88 (2012); N. Tomassetti, Astroph. Space Sci. 342, 131 (2012)], distinctly different from the commonly studied secondary/primary ratios of heavier elements such as B/C and B/O presented in Precision Measurement of the Boron to Carbon Flux Ratio and Observation of New Properties of Secondary Cosmic Rays Lithium, Beryllium and Boron.
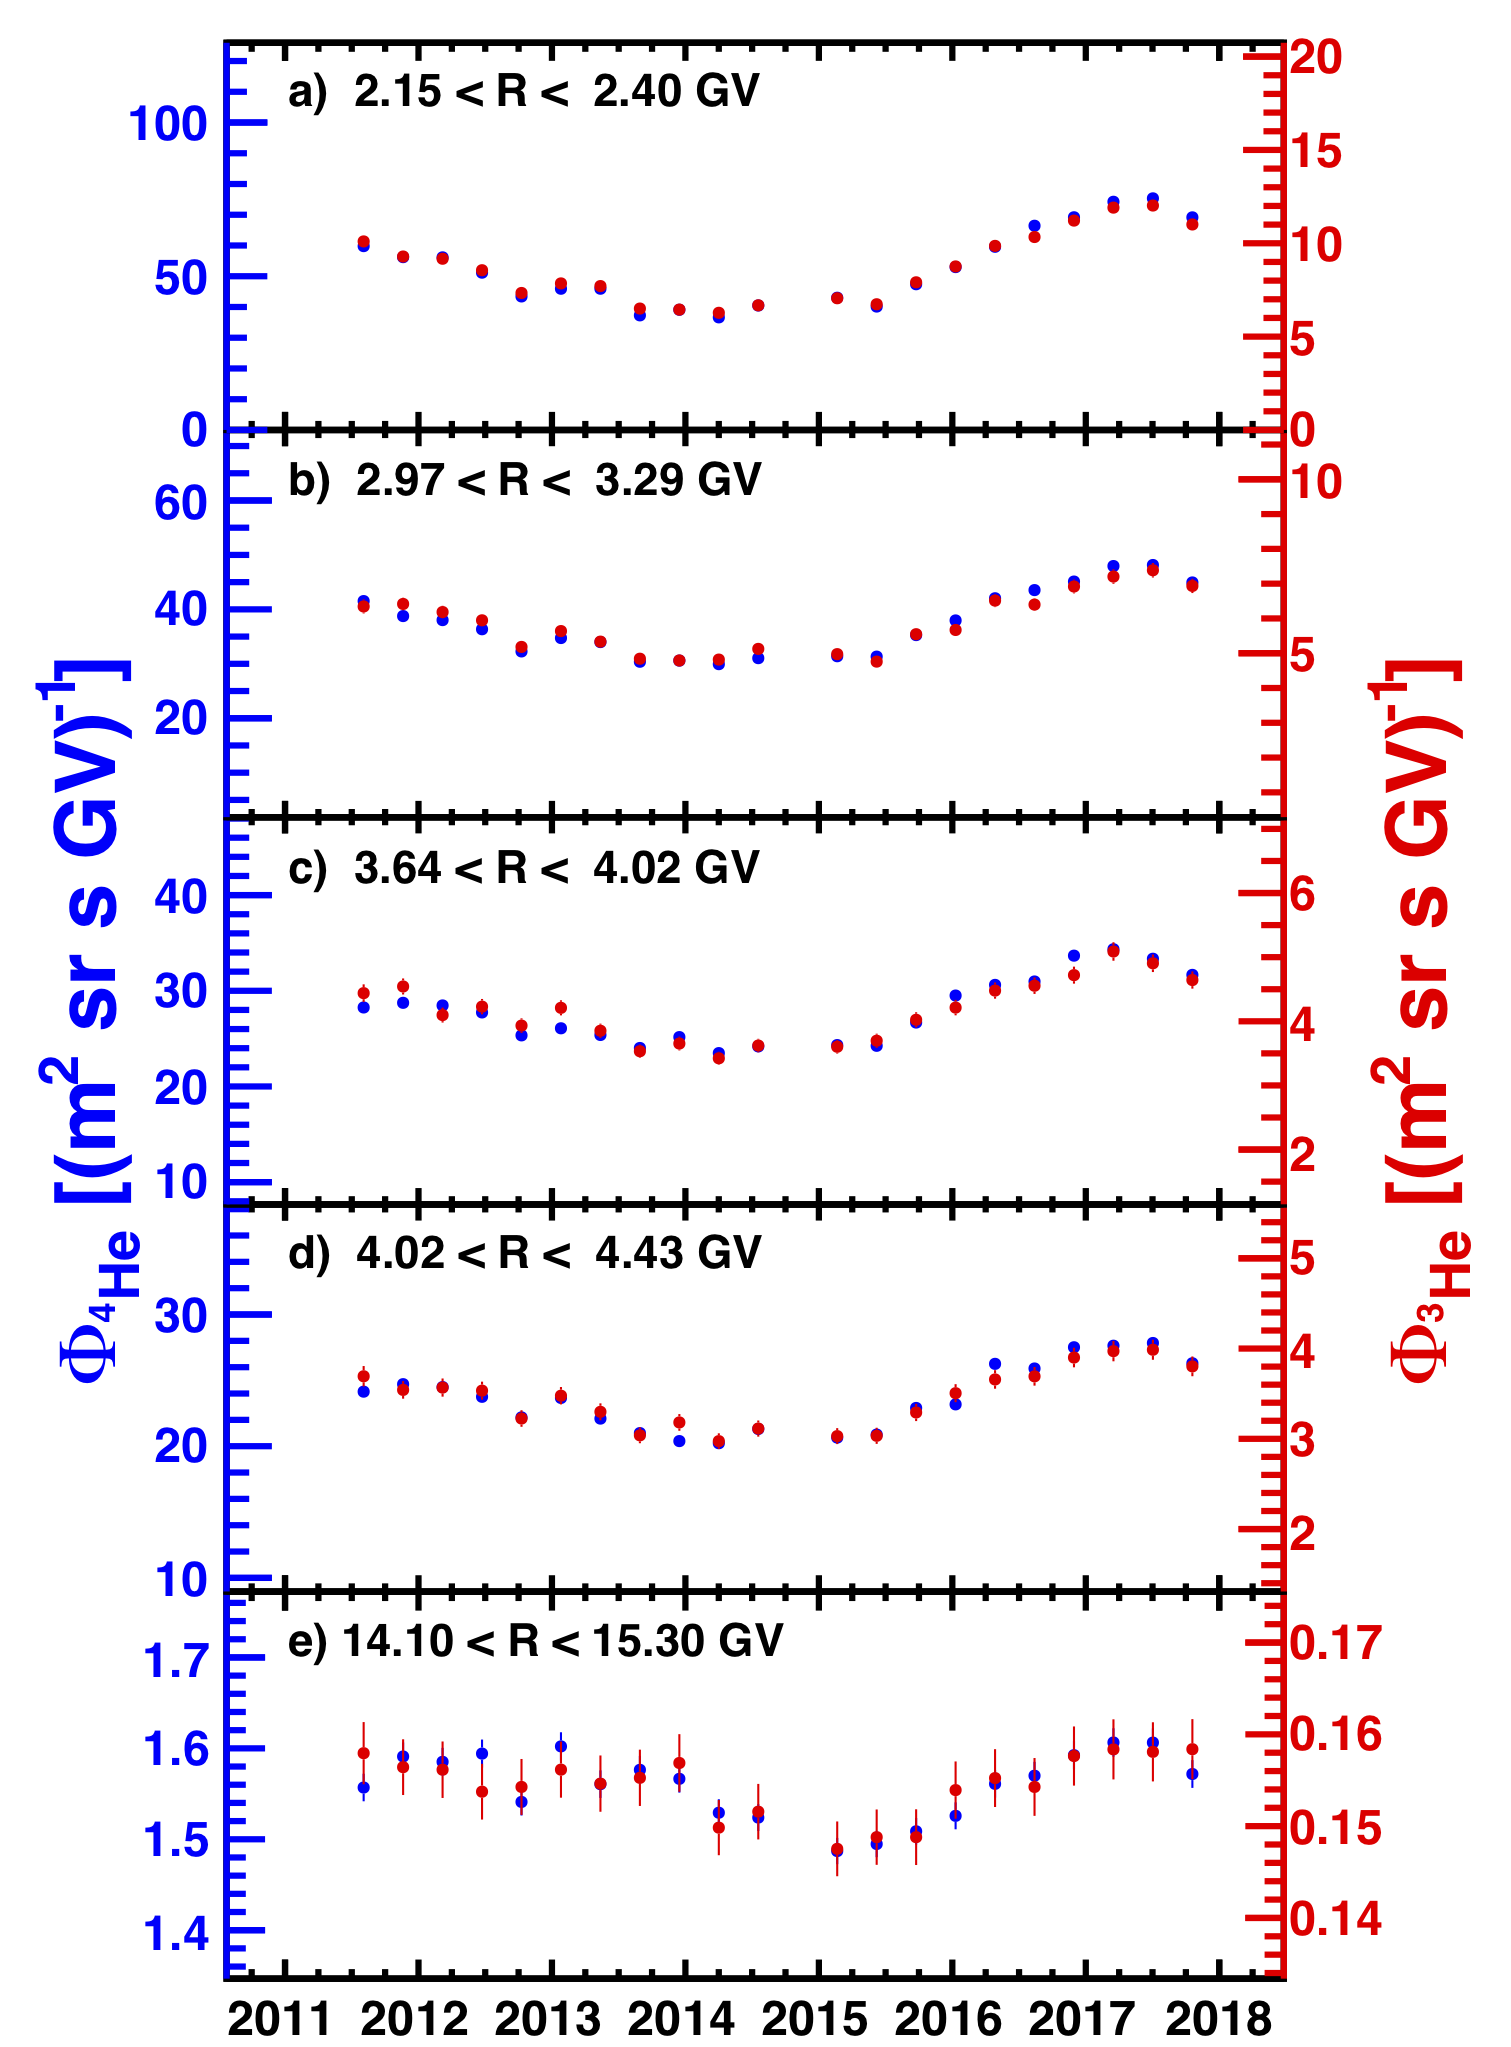
The AMS measurements are based on 100 million ${^{4}\textrm{He}}$ nuclei in the rigidity range from 2.1 to 21 GV, and 18 million ${^{3}\textrm{He}}$ from 1.9 to 15 GV collected from May 2011 to November 2017. The measured ${^{3}\textrm{He}}$ and ${^{4}\textrm{He}}$ spectra exhibit nearly identical variations with time as presented in Figure 1. The observed variations are compatible with those observed by AMS in the proton flux, and in the electron and positron fluxes. Together, these provide important insights on the dynamics of solar modulation.
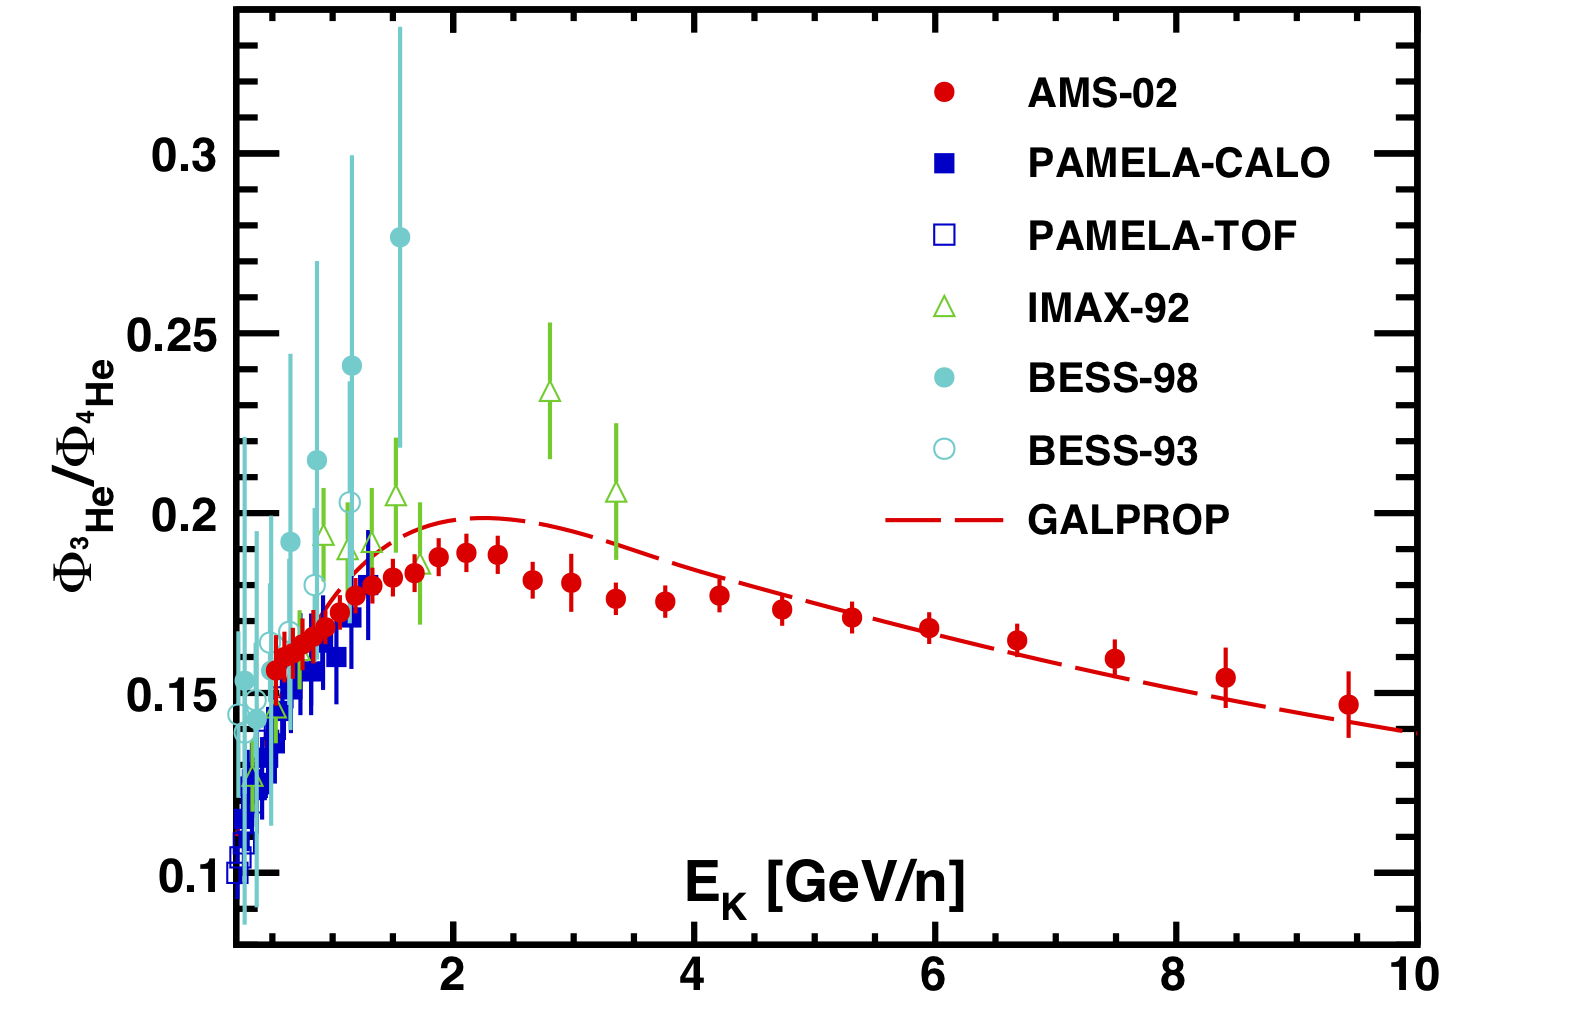
To compare with previous experiments [O. Reimer et al., Astroph. J. 496, 490 (1998); J. Z. Wang et al., Astroph. J. 564, 244 (2002); Z. D. Myers et al., Proc. of the 28th Int. Cosmic Rays Conf. (ICRC 2003), 1805, Tokyo, Japan (2003); E. Mocchiutti for the WIZARD/Caprice Coll., Proc. of the 28th Int. Cosmic Rays Conf. (ICRC 2003), 1809, Tokyo, Japan (2003); O. Adriani et al., Astroph. J. 818, 68 (2016)], the ${^{3}\textrm{He}}$ and ${^{4}\textrm{He}}$ fluxes and their ratio have also been measured as functions of the kinetic energy per nucleon, ${E_{K} = M(\gamma-1)/A}$, where ${\gamma=1/\sqrt{1-\beta^2}}$ and $M$ and $A$ are the ${^{3}\textrm{He}}$ or ${^{4}\textrm{He}}$ mass and atomic number. The resulting ${^{3}\textrm{He}/^{4}\textrm{He}}$ flux ratio is shown in Figure 2 together with earlier experiments and the GALPROP model [We used GALPROP WebRun; A. E. Vladimirov, S. W. Digel, G. Jóhannesson, P. F. Michelson, I. V. Moskalenko, P. L. Nolan, E. Orlando, T. A. Porter, and A. W. Strong, Comput. Phys. Commun.182,1156(2011); with parametrization from R.Trotta, G.Jóhannesson, I.V. Moskalenko, T. A. Porter, R. Ruiz de Austri, and A. W. Strong, Astrophys. J. 729, 106 (2011)] predictions corresponding to the data collection period. The AMS result provides a precision measurement and covers a large energy range.
The time averaged ${^{3}\textrm{He}/^{4}\textrm{He}}$ flux ratio as a function of rigidity is shown in Figure 3(a). Above 4 GV, the ${^{3}\textrm{He}/^{4}\textrm{He}}$ flux ratio is time independent and is well described with a single power law, $C(R/4 \textrm{GV})^{\Delta}$. A fit to the data yields ${\Delta = -0.294 \pm 0.004}$ and ${C = 0.1476~\pm~0.0004}$, with ${\chi^{2}/\textrm{d.o.f.} = 15.7/13}$. Below 4 GV, to study the time and rigidity dependence of the ${^{3}\textrm{He}/^{4}\textrm{He}}$ flux ratio, fits to ${C(R/4 \textrm{GV})^{\delta}}$ for each period of 4 Bartels rotations were performed. The results of the fits are shown as a shaded band in Figure 3(a) and yield an average $\delta$ of ${\langle \delta \rangle} = -0.21 \pm 0.02$ with a time-variation of $\pm 0.05$. Different from the B/O and B/C flux ratios, which show a maximum around 4 GV, see Figures SM 9(c) and SM 10(c) in Phys.Rev.Lett.120-021101, the ${^{3}\textrm{He}/^{4}\textrm{He}}$ flux ratio is steadily decreasing with rigidity. Because of different propagation volumes and different inelastic interaction cross sections of He, B, C and O, the B/O and B/C flux ratio rigidity dependence may be different from the ${^{3}\textrm{He}/^{4}\textrm{He}}$ flux ratio rigidity dependence and this provides important information to discriminate among different cosmic ray models [I. A. Grenier, J. H. Black and A. W. Strong, Annu. Rev. Astron. Astrophys. 53, 199 (2015); P. Blasi, Astron. Astrophys. Rev. 21, 70 (2013); A. W. Strong, I. V. Moskalenko, and V. S. Ptuskin, Annu. Rev. Nucl. Part. Sci. 57, 285 (2007); G. Jóhannesson et al., Astroph. J. 824, 16 (2016); Y. Génolini, D. Maurin, I. V. Moskalenko, and M. Unger, Phys. Rev. C 98, 034611 (2018)]].
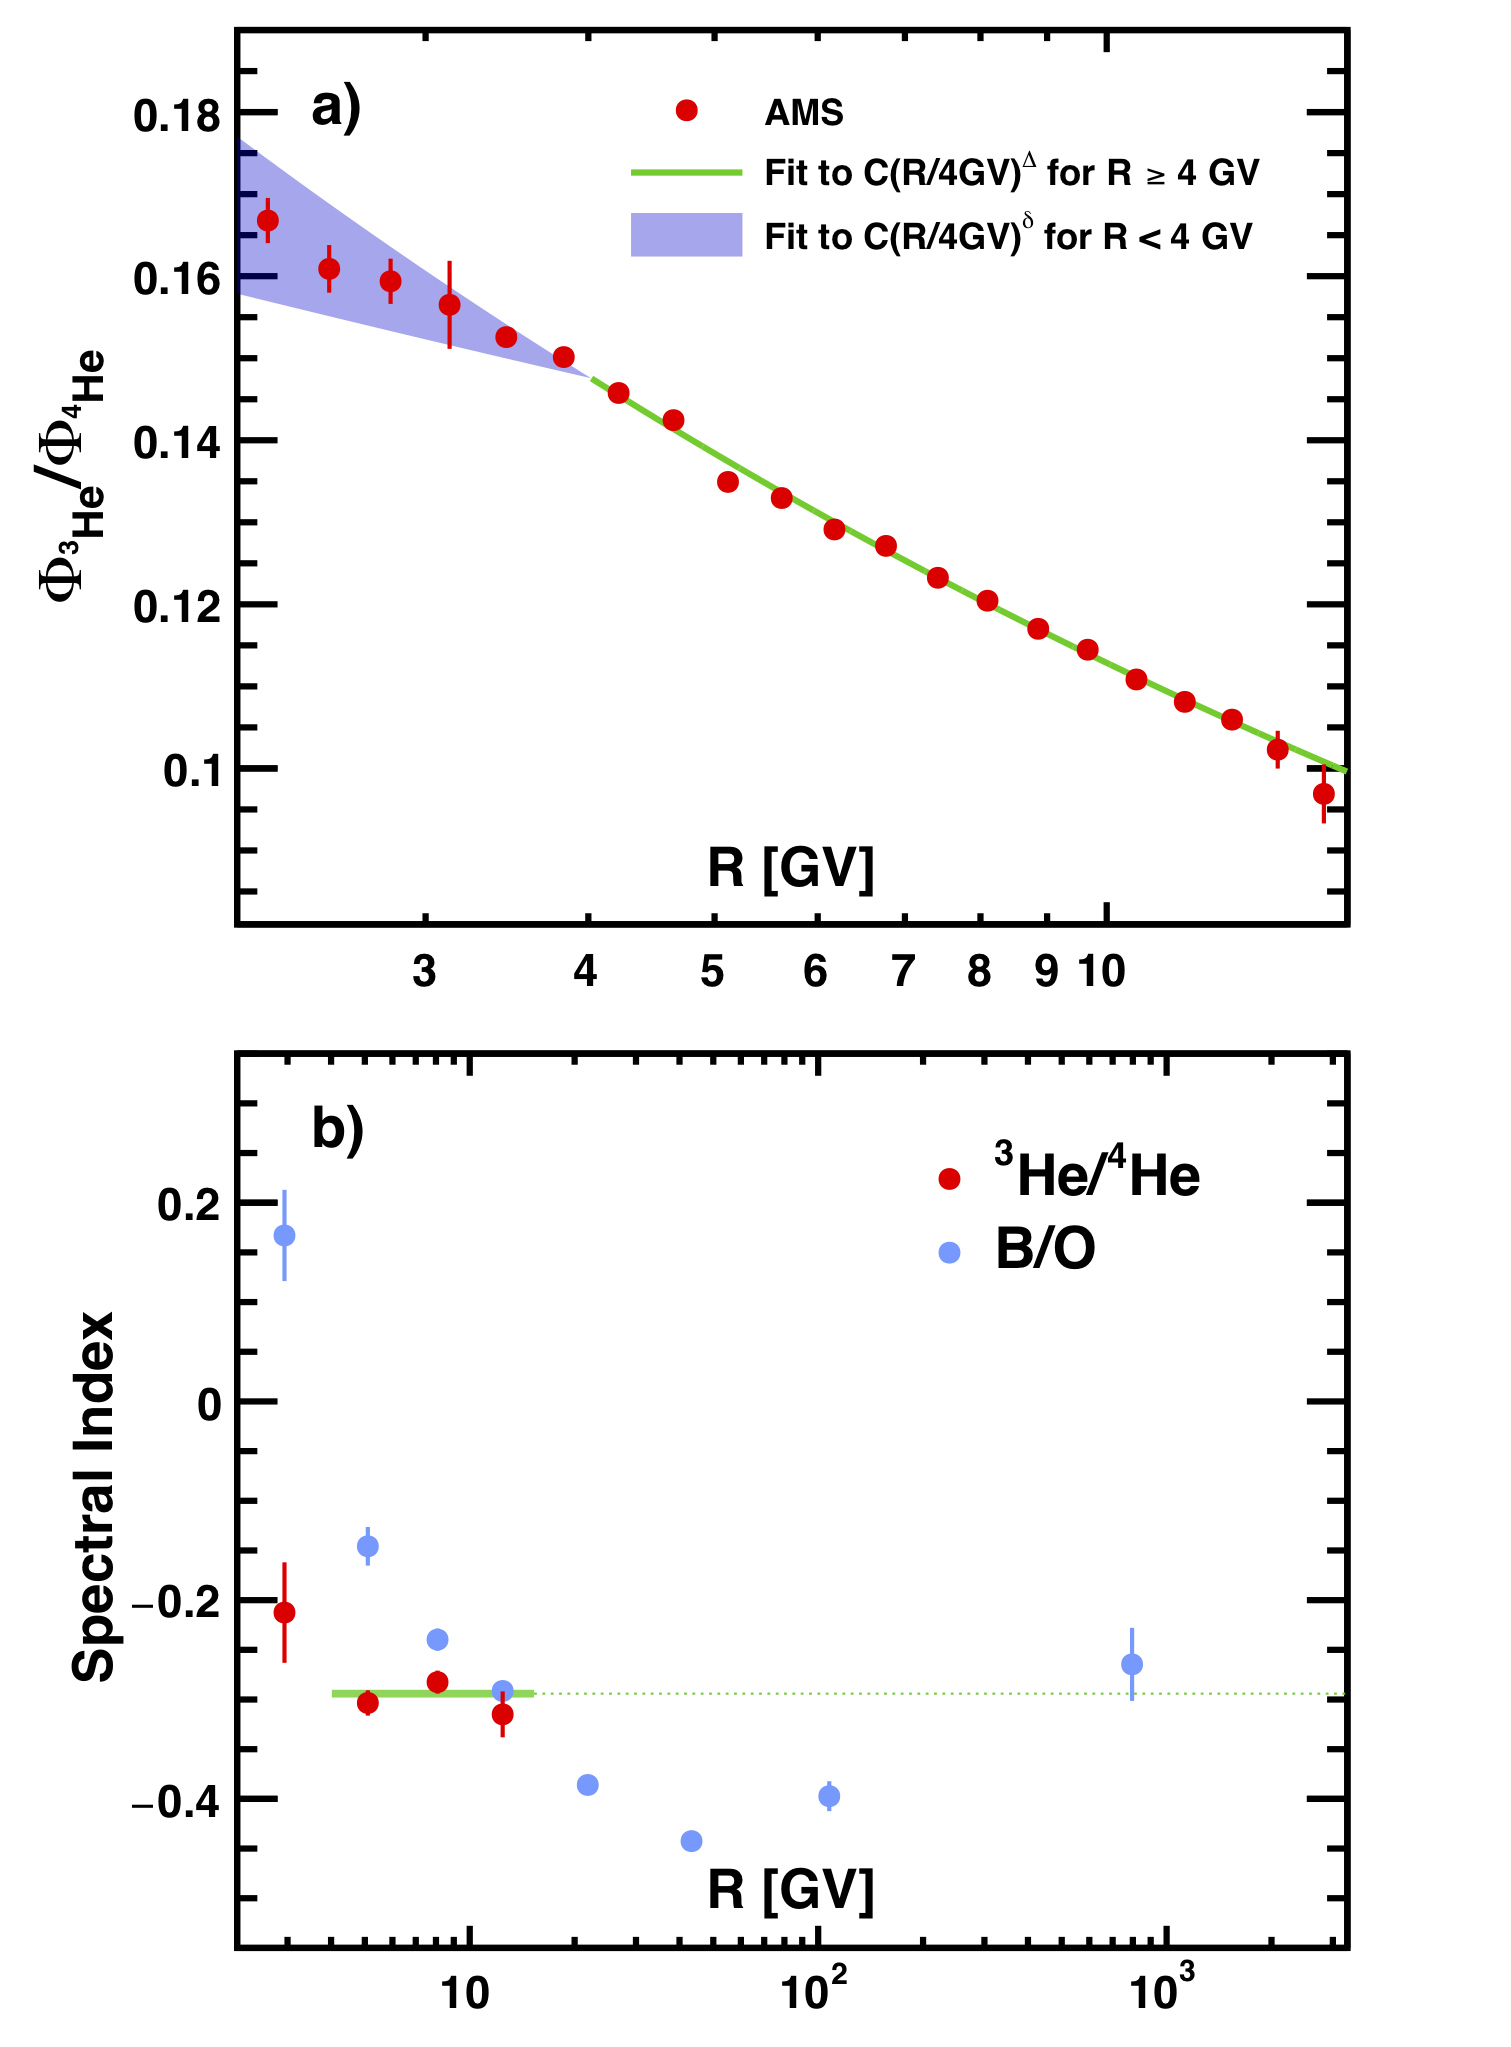
Figure 3(b) shows the ${^{3}\textrm{He}/^{4}\textrm{He}}$ flux ratio spectral index as a function of $R$ for 4 independent rigidity bins. As seen, above 4 GV, the spectral index shows no dependence with rigidity with an average value of ${\Delta = -0.294 \pm 0.004}$. The extrapolation of $\Delta$ to higher energies is shown as a dotted line. The B/O and B/C flux ratio spectral indices are shown as blue filled squares and blue open squares, respectively. As seen, the ${^{3}\textrm{He}/^{4}\textrm{He}}$ spectral index extrapolation to the highest energies is in agreement with the B/O and B/C spectral indices.